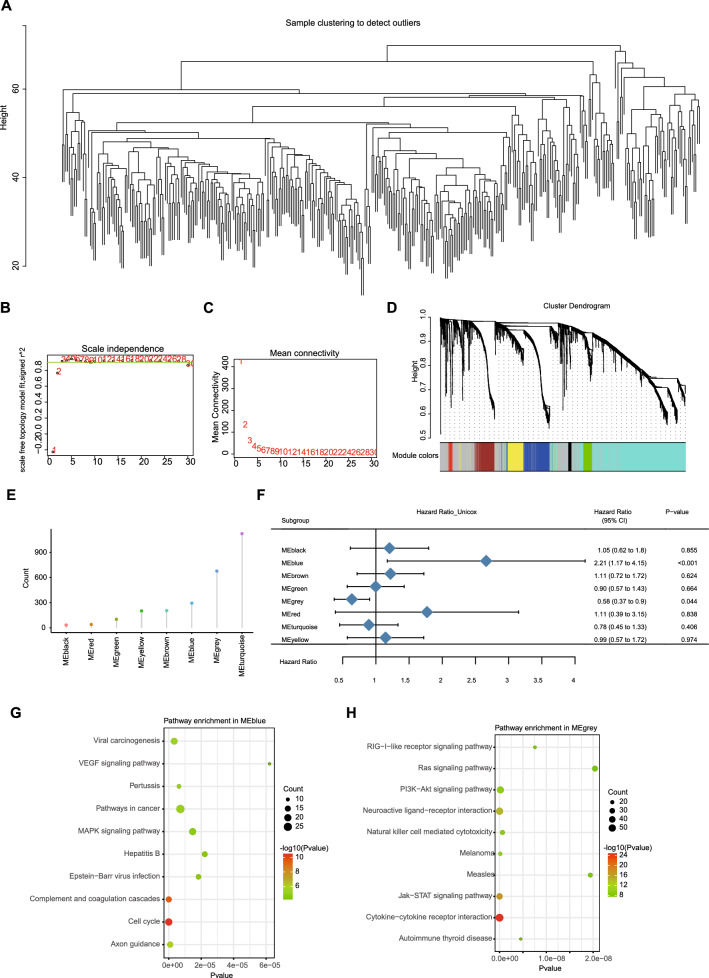
Fig. 9.
Identification of immune gene co-expression modules of LIHC. A Sample clustering. B Scale-free fit index for various soft-thresholding powers (β). C Mean connectivity for various soft-thresholding powers. D Dendrogram of all differentially expressed genes clustered based on a dissimilarity measure (1-TOM). E Gene counts in each module. F Forest maps of single factor survival analysis of 8 modules of LIHC. G, H Dot plot showing the top 10 KEGG terms in the MEblue module (G) and the MEgrey module (H). The dot size and color intensity represent the gene count and enrichment level, respectively

