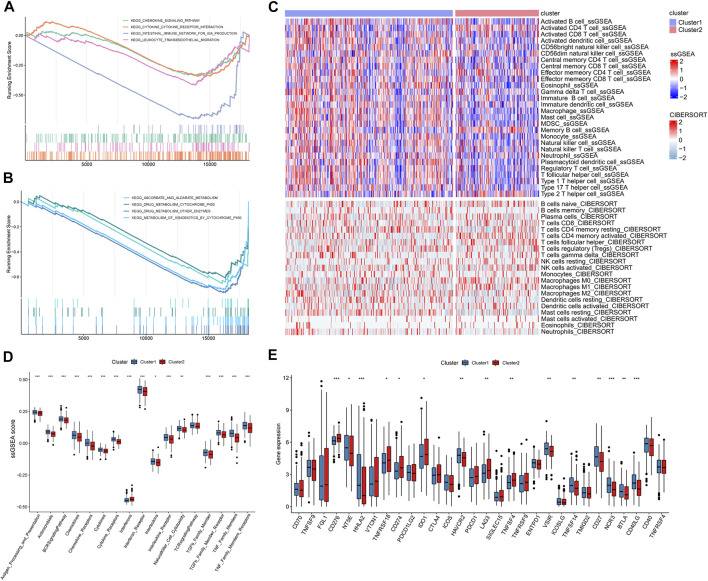
FIGURE 4.
GSEA and immune landscape of distinct m5c/m6a modification subtypes. (A,B) GSEA of pathways related to different subtypes based on the C2 gene set. (C) Immune cell landscape of two m5c/m6a subtypes. (D) Boxplots comparing the ssGSEA scores of different molecular subtypes. (E) Boxplots comparing immune checkpoint gene expression of different molecular subtypes. (*: p < 0.05, **: p < 0.01, and ***: p < 0.001).

