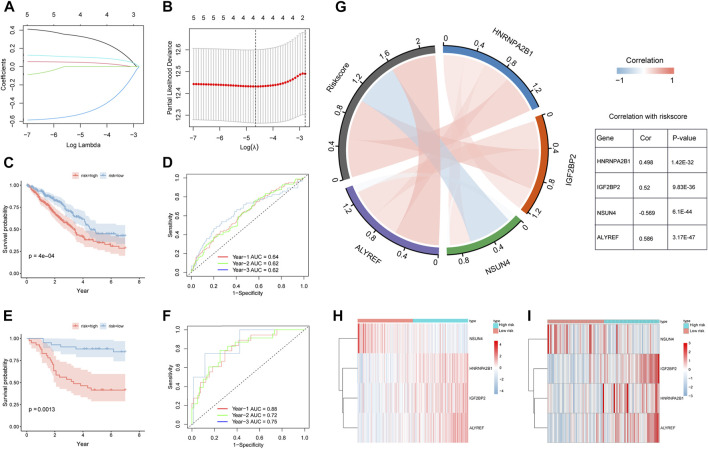
FIGURE 5.
Construction and validation of m5C/m6A regulator-related prognostic model. (A,B) LASSO-Cox regression model by 10-fold cross-validation for OS in LUAD. (C) KM curves for the OS of high-risk and low-risk groups in TCGA training set. (D) Time ROC for OS in TCGA training set. (E) KM curves for the OS of high- and low-risk groups in the GEO testing set. (F) Time ROC for OS in the GEO training set. (G) Correlation chord plot of HNRNPA2B1, IGF2BP2, NSUN4, ALYREF, and risk score. (H,I) Heatmaps of expression levels of HNRNPA2B1, IGF2BP2, NSUN4, and ALYREF in the high-risk and low-risk groups of the training and testing sets.

