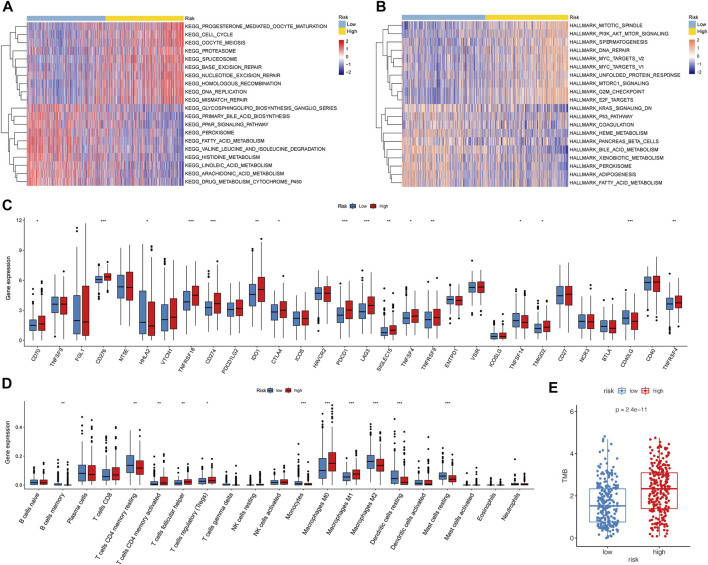
FIGURE 7.
Biological characteristics, pathways, and immune-related analyses between high- and low-risk groups. (A,B) Heatmaps of GSVA between the different risk groups with C2 and hallmark gene sets. (C) Boxplots illustrating expression of immune checkpoints of the high- and low-risk groups. (D) Boxplots illustrating abundance of immune cells in the high- and low-risk groups. Red boxes: high-risk group; blue boxes: low-risk group. (*: p < 0.05, **: p < 0.01, and ***: p < 0.001). (E) High-risk group had higher TMB than the low-risk group (p = 1e-11).

