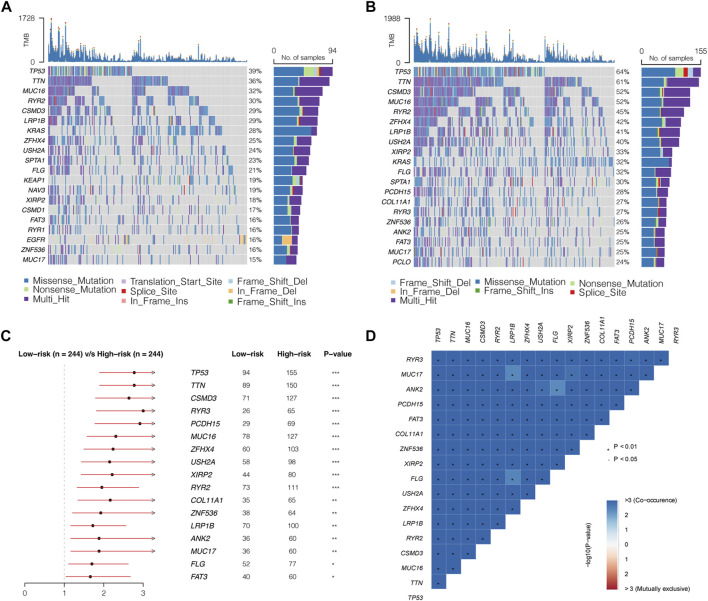
FIGURE 8.
Mutation landscapes of low- and high- risk groups. (A,B) Waterfall diagrams displaying 20 genes with the highest mutation rates in the low- and high-risk groups. (C) Seventeen genes mutating differently in the two groups. (D) Correlations of 17 differently mutating genes. Red represents co-occurrence, and blue represents mutually exclusive.

