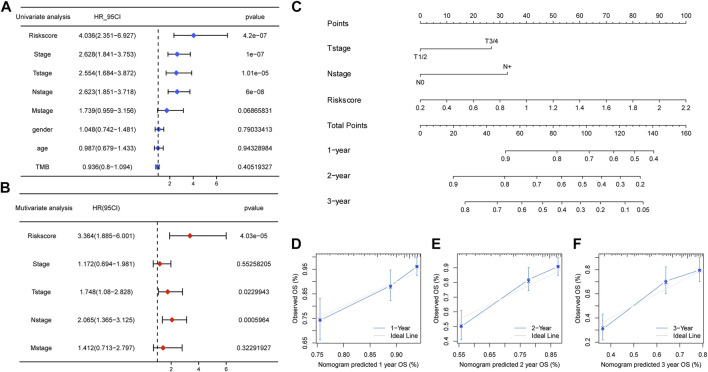
FIGURE 9.
Clinical predicting model based on the risk score. (A,B) Univariate and multivariate Cox regression analyses for the risk score and clinical factors. The risk score, T stage, and N stage were independent prognostic factors for TCGA-LUAD patients. (C) Nomogram predicting for 1-, 2-, and 3-year OS with the independent prognostic factors. (D–F) 1 year, 2 years, and 3 years of calibration plots for the clinical predictive model.

