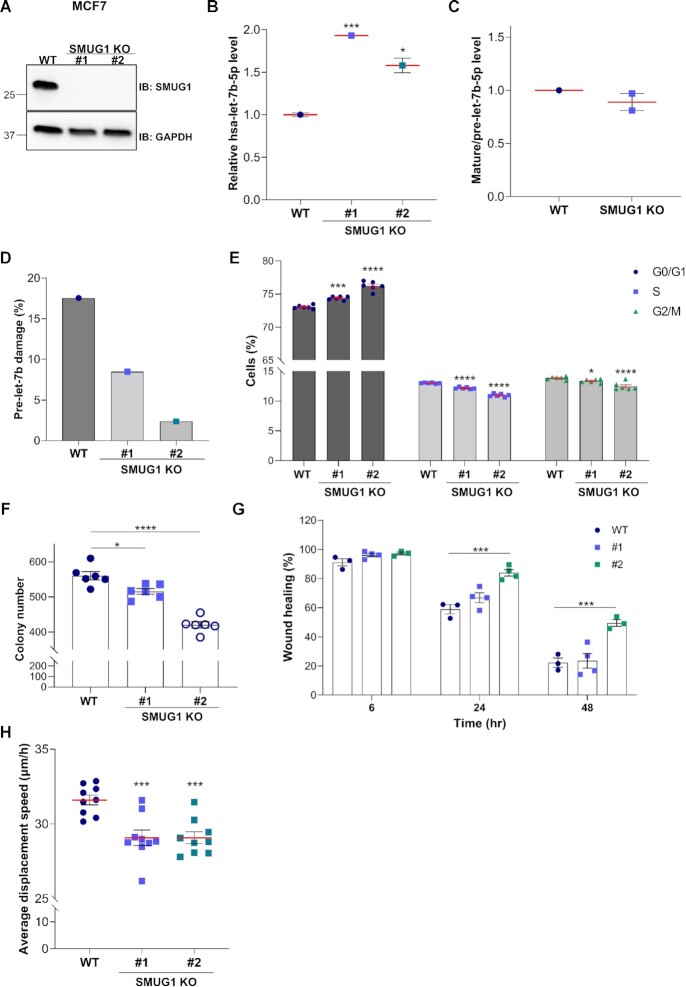
Figure 6.
SMUG1 KO cells present increased levels of let-7b-5p and show negative effects on cell proliferation in MCF7 cells. (A) Representative western blotting showing SMUG1 protein levels in in two independent SMUG1 KO clones in MCF7 cells. GAPDH was used as loading control. (B) Relative let-7b-5p levels in WT and SMUG1 KO cells measured by QPCR. (C) Relative mature hsa-let-7b-5p to pre-let-7b ratios in SMUG1 KO cells as measured by ddPCR. (D) Pre-let-7b RNA damage in two independent SMUG1 KO clones as measured by ddPCR. (E) Cell cycle distribution of SMUG1 KO cells. Data represent means ± s.e.m., n = 6. (F) Colony formation assay in SMUG1 KO cells. Bar graph showing the colony number after culturing the cells for 12 days. Data represent means ± s.e.m., n = 3. (G) Cell migration in SMUG1 KO clones as measured by wound-healing assay. Bar graphs showing the percentage of migration at the different time points relative to time 0. Data represent means ± s.e.m., n = 3. (H) Average displacement speed calculated based on particle tracking data. Box plots showing the average cell displacement speed per each clone over a time period of 12 h, n = 9 separate microscopic fields of view. (B, E–H) * P ≤ 0.05, *** P ≤ 0.001, **** P ≤ 0.0001 (two-tailed Student's t-test and one-way ANOVA).

