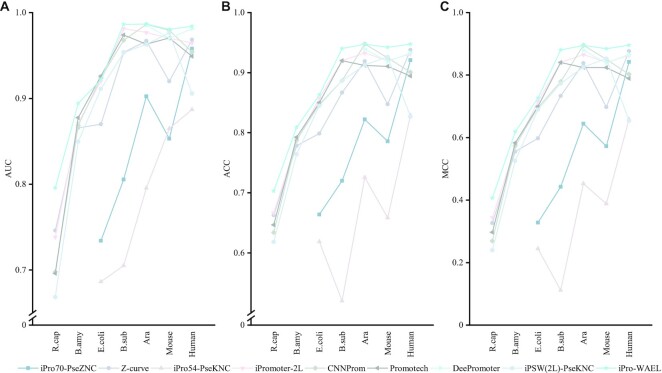
Figure 5.
The performance evaluation of iPro-WAEL and other predictors on the seven species. (A–C) represent the AUC, ACC and MCC of the models, respectively. Discontinuous lines represent that the method cannot be applied to these datasets. Note that the performance of Human, Arabidopsis and Mouse are the average results of multiple datasets.

