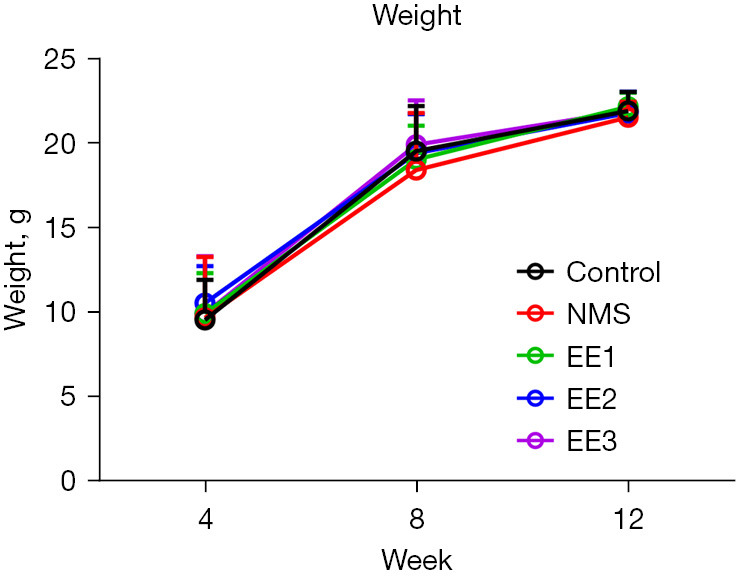
Figure 2.

The weight of mice in each group. There was no significant difference in weight between groups. All data were expressed as mean ± SD. NMS, neonatal maternal separation; EE, enriched environment; EE1 group, prepubertal EE group; EE2 group, pubertal EE group; EE3 group, adult EE group; SD, standard deviation.
