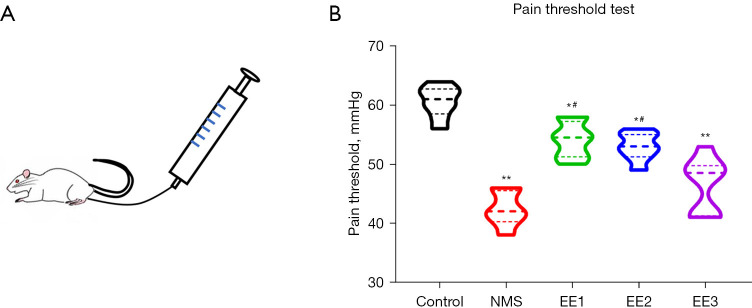
Figure 3.
The visceral pain threshold of mice in each group. (A) Schematic of PTT. (B) The visceral pain threshold of each group. All data were expressed as mean ± SD. *, P<0.05, **, P<0.01 vs. Control group; #, P<0.05 vs. NMS group. NMS, neonatal maternal separation; EE, enriched environment; EE1 group, prepubertal EE group; EE2 group, pubertal EE group; EE3 group, adult EE group; PTT, pain threshold test; SD, standard deviation.

