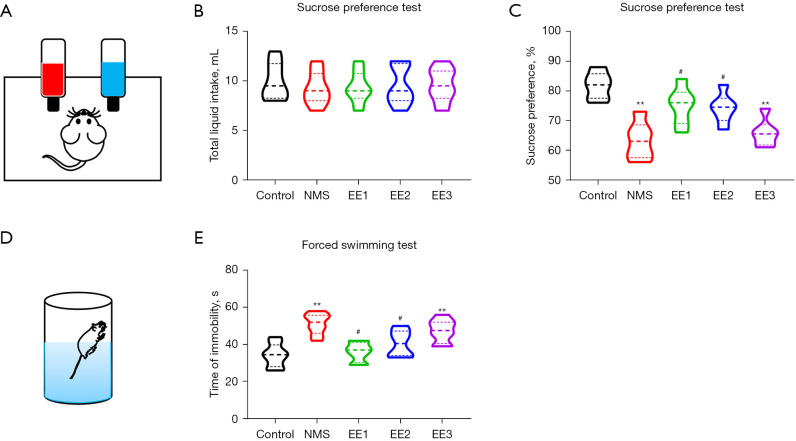
Figure 5.
EE1 and EE2 groups alleviated NMS-induced depression-like behaviors. (A) Schematic of SPT. (B) Total liquid intake and (C) sucrose preference rate in SPT. (D) Schematic of FST. (E) Time of immobility in FST. All data were expressed as mean ± SD. **, P<0.01 vs. Control group; #, P<0.05 vs. NMS group. NMS, neonatal maternal separation; EE, enriched environment; EE1 group, prepubertal EE group; EE2 group, pubertal EE group; EE3 group, adult EE group; SPT, sucrose preference test; FST, forced swimming test; SD, standard deviation.

