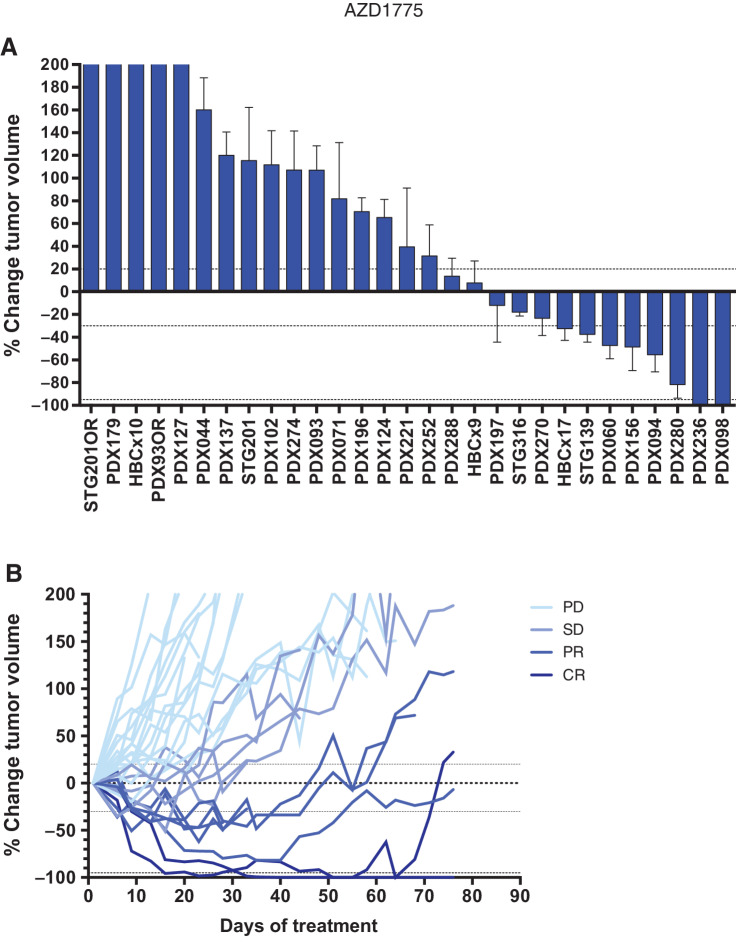
Figure 1.
Screening of patient-derived tumor xenografts identifies a subset of WEE1- inhibitor intrinsically sensitive tumors. A, Waterfall plot showing the best response to AZD1775, plotted as the percentage of tumor volume change compared with the tumor volume on day 1 after at least approximately 21 days of treatment using the 120 mg/kg schedule summarized in Supplementary Table S2 (n = 29). +20% and −30% are marked by dashed lines to indicate the range of PR, SD, and PD. Bars represent means of an average of six individual tumors and error bars represent SEM. B, Time response to AZD1775 for the PDX models shown in A. The percentage of tumor volume change during AZD1775 treatment is plotted. Shades of blue are used to label PDX models with PD, SD, PR, or CR response to the treatment.

