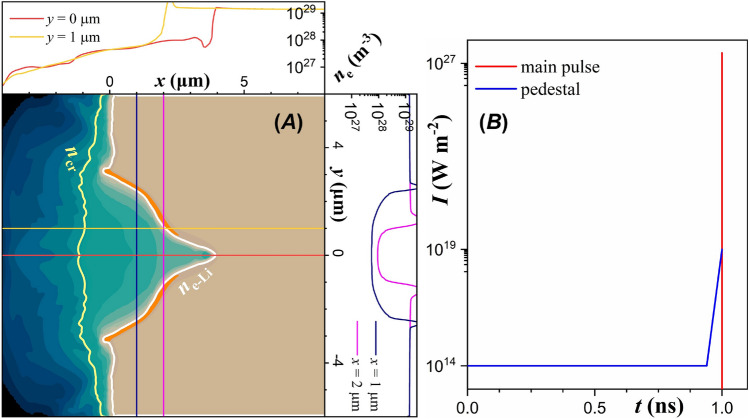
Figure 1.
(A) Electron number density as given by MHD simulations (data taken from reference60), following irradiation of a lithium foil. The yellow contour line is at the critical density and the white contour line is at the lithium solid electron density. The orange saturated contour is overcritical for laser intensities above . (B) The ASE pedestal profile used in reference60 (blue line) compared with the main laser pulse profile presently employed (red line).

