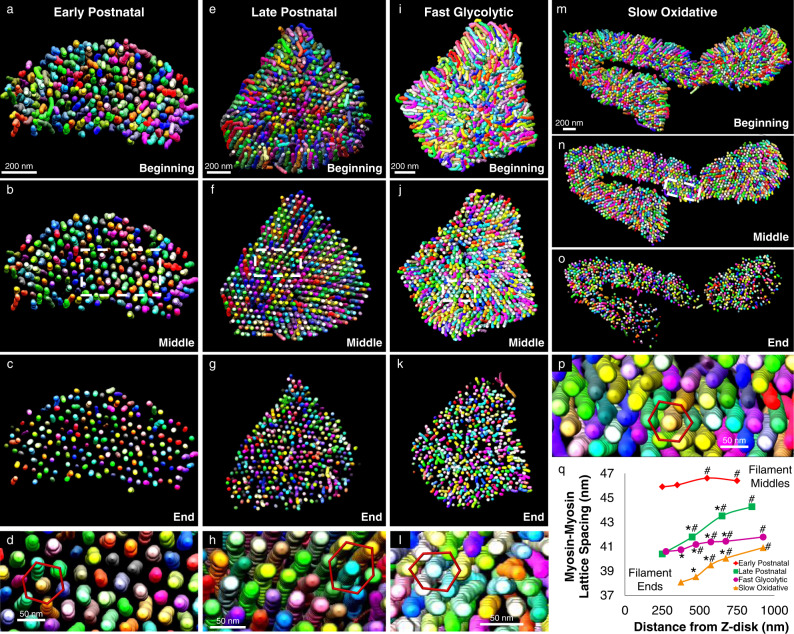
Fig. 4. Myosin lattice spacing intrasarcomere heterogeneity.
a–p 3D renderings of myosin filaments (various colors) within representative single sarcomeres from Early Postnatal (a–d), Late Postnatal (e–h), Fast Glycolytic (i–l), and Slow Oxidative (m–p) muscles showing the entire sarcomere (a, e, i, m), half the sarcomere (b, f, j, n), the ends of the sarcomere (c, g, k, o), and the hexagonal filament lattice from the middle of the sarcomere (d, h, l, p). q Myosin-myosin lattice spacing as a function of distance from the Z-disk for Early Postnatal (means shown as diamonds), Late Postnatal (squares), Fast Glycolytic (circles), and Slow Oxidative (triangles) muscles. N values: Early Postnatal-88, 88, 90, and 89 muscle cross-sections from center to end, respectively; Late Postnatal-342, 342, 340, and 333 muscle cross-sections; Fast Glycolytic-139, 139, 139, 139, 137, and 137 muscle cross-sections; Slow Oxidative-138, 138, 138, 138, and 93 muscle cross-sections. Standard error bars are smaller than mean symbols, thus not visible. *Significantly different from filament middles. #significantly different from filament ends. Two-sided, one-way ANOVA with a Tukey’s HSD post hoc test.

