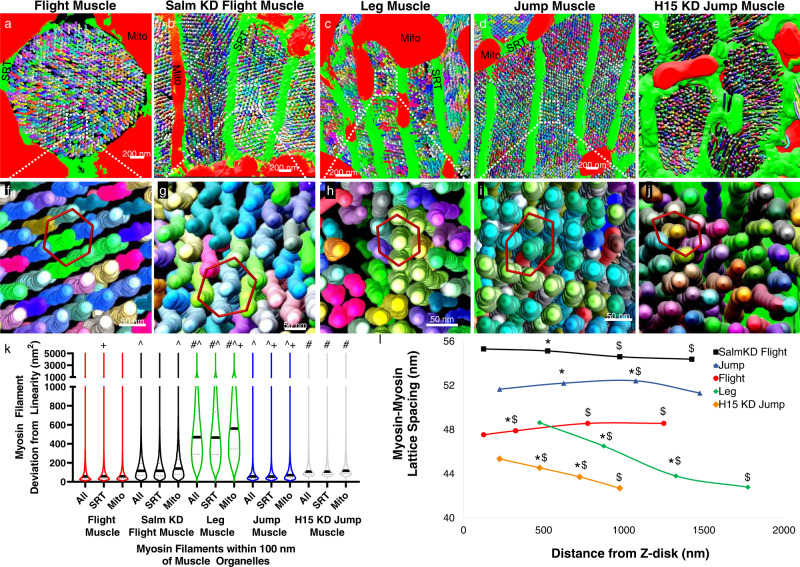
Fig. 5. Muscle specification factors salm and H15 regulate myosin filament curvature and myosin-myosin lattice spacing in Drosophila muscle.
a–e 3D renderings of myosin filaments (various colors) and their proximal mitochondria (mito, red) and sarcoplasmic reticulum/t-tubules (SRT, green) in Drosophila flight (a), salm KD flight (b), leg (c), jump (d), and H15 KD jump (e) muscles. f–j 3D rendering of myosin filament lattice in Drosophila flight (f), salm KD flight (g), leg (h), jump (i), and H15 KD jump (j) muscles. k Myosin filament curvature for filaments within 100 nm of sarcomere boundary, SRT, and mitochondria. Thick black lines represent median values, thin dotted lines represent upper and lower quartile values. Width of the violin plot represents the relative number of filaments at a given value. #Significantly different from Jump muscles. ^Significantly different from Flight muscles. +Significantly different from All. N values: Leg-104,090 total filaments; Jump-992,756; Flight-1,282,854; salm KD Flight-338,765. H15 KD Jump-113,615. l Myosin-myosin lattice spacing as a function of distance from the Z-disk for Leg (means shown as diamonds), salm KD Flight (squares), Flight (circles), Jump (triangles), and H15 KD Jump (diamonds) muscles. N values: Leg-38, 40, 36, and 38 muscle cross-sections from center to end, respectively; salm KD Flight-36, 36, 36, and 36 muscle cross-sections; Flight-60, 60, 60, and 58 muscle cross-sections; Jump-80, 79, 80, and 78 muscle cross-sections; H15 KD Jump-63, 62, 62, and 60 muscle cross-sections. Standard error bars are smaller than mean symbols, thus not visible. *Significantly different from filament middles. $Significantly different from filament ends. Two-sided, one-way ANOVA with a Tukey’s HSD post hoc test.

