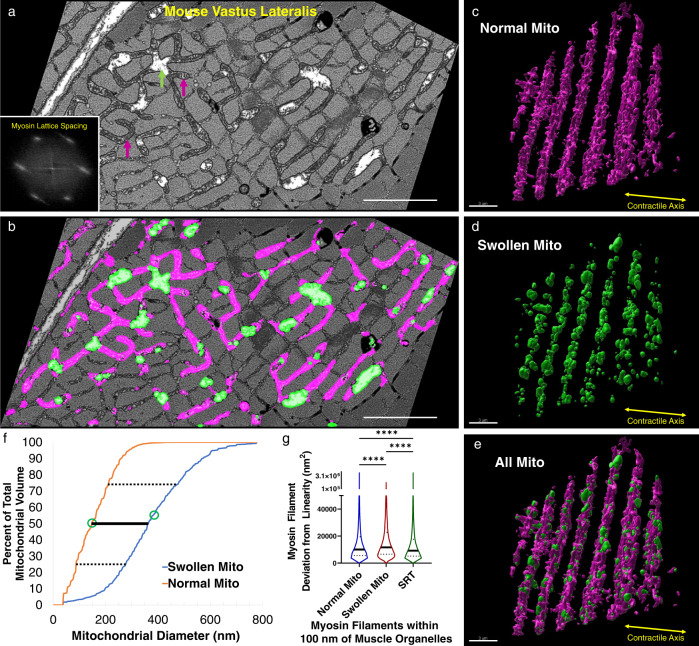
Fig. 6. Acute, localized mitochondrial swelling increases the curvature of nearby myosin filaments.
a Raw 2D FIB-SEM image of mouse vastus lateralis muscle with fixation induced swelling within several regions of the mitochondrial network. Green arrows: swollen mitochondria. Magenta arrows: normal mitochondria. Inset, average fast fourier transform image of raw FIB-SEM data across an entire single sarcomere showing hexagonal myosin lattice spacing. b Raw image from a overlaid with machine learning segmentation results for swollen (green) and normal (magenta) mitochondria. Scale bar: 1 µm (c–e) 3D renderings of normal (c), swollen (d), and all (e) mitochondria within a mouse vastus lateralis muscle. f Mitochondrial diameters for swollen (orange line) and normal (blue line) mitochondria. Dotted lines: upper and lower quartile values, solid line: median value, open circles: mean value. Total volumes assessed: swollen—0.579 µm3, normal—1.864 µm3. g Myosin filament curvature for filaments within 100 nm of swollen mitochondria, normal mitochondria, and SRT. Thick black lines represent median values, thin dotted lines represent upper and lower quartile values. Width of the violin plot represents the relative number of filaments at a given value. N = 46,400, 11,289, and 74,418 myosin filaments, 2 cells for Normal, Swollen, and SRT, respectively. ****Significantly different (p < 0.0001) by one-way ANOVA (two-sided) with Tukey’s post hoc test. Scale bars: 3 µm.

