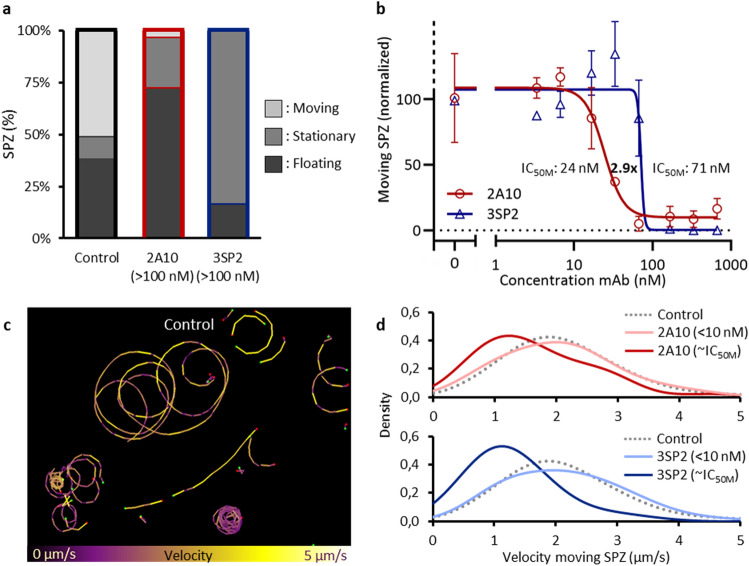
Figure 2.
Effect of anti-CSP mAb on SPZ movement and attachment. (b) The movement pattern distribution for control SPZ and SPZ exposed to a high concentration (> 100 nM) of the anti-CSP mAbs 2A10 and 3SP2. (b) The normalized percentage of moving SPZ plotted against the concentration of mAb to determine the IC50M value at which movement of SPZ was 50% reduced. (c) Tracks of SPZ moving in vitro on a glass surface, color-coded for velocity using color range: purple (low velocity) to yellow (high velocity). (d) The probability distribution plotted of the velocity of control SPZ (median: 2.0 (IQR: 1.5–2.6) μm/s), SPZ exposed to low concentrations of 2A10 and 3SP2 (7 nM) (median velocity 2A10: 2.1 (IQR: 1.4–2.6) μm/s, median velocity 3SP2: 2.1 (IQR: 1.4–2.8) μm/s ) and SPZ exposed to approximately their IC50M concentration (median velocity while exposed to 33 nM 2A10: 1.4 (IQR: 1.0–2.2) μm/s, median velocity while exposed to 66 nM 3SP2: 1.1 (IQR: 0.9–1.6) μm/s).

