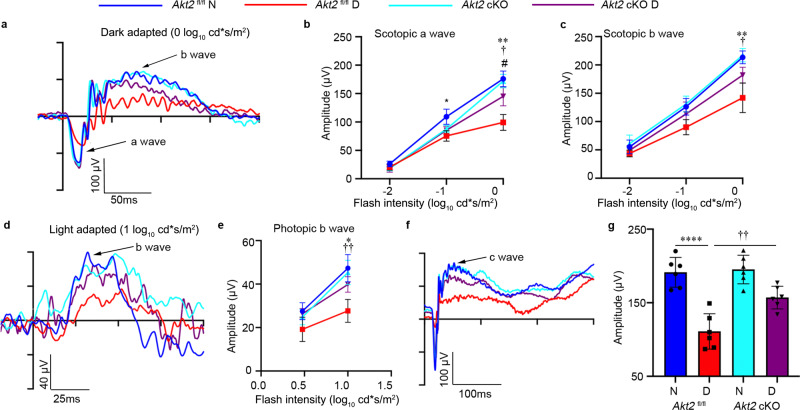
Fig. 1. Electroretinography (ERG) suggests that RPE-specific Akt2 cKO partially rescues diabetes-induced disruption of retinal function (4 month duration of diabetes).
a Representative scotopic ERG a- and b-waveforms, showing response to a 0 log10 cd·s/m2 stimulus luminance after overnight dark adaptation. Scotopic (b) a-wave and (c) b-wave amplitudes were decreased in diabetic Akt2fl/fl mice compared to nondiabetic controls. These changes were partially rescued in RPE-specific Akt2 cKO diabetic mice. d Representative photopic ERG waveforms response to a 1 log10 cd·s/m2 stimulus luminance after light adaptation. e Induction of diabetes decreased the photopic b-wave amplitude in diabetic Akt2fl/fl mice, which was rescued in RPE-specific Akt2 cKO diabetic mice. f Representative ERG c-waveforms. (g) Diabetes decreased the c-wave amplitude in Akt2fl/fl mice compared to nondiabetic animals, which was partially mitigated in Akt2 cKO diabetic mice. In (b, c, e, g), n = 6 mice for each group, the data are expressed as mean ± SD. *p < 0.05; **p < 0.01; ****p < 0.0001 shows changes between diabetic Akt2fl/fl and Akt2fl/fl nondiabetic control. †p < 0.05, ††p < 0.01 represents changes between diabetic Akt2 cKO and diabetic Akt2fl/fl mice. #p < 0.05 represents changes of diabetic Akt2 cKO versus nondiabetic Akt2 cKO mice. Statistical test used in (b, c, e) is Two-way ANOVA followed by Tukey’s multiple comparisons test, and in (g) is One-way ANOVA followed by a Tukey’s post hoc test. Exact p values are: b At −1 log10 cd*s/m2, p = 0.0116 (Akt2 fl/fl D vs. Akt2 fl/fl N); At 0 log10 cd*s/m2, p = 0.0017 (Akt2 fl/fl D vs. Akt2 fl/fl N), p = 0.0357 (Akt2 cKO D vs. Akt2 fl/fl D), p = 0.0244 (Akt2 cKO D vs. Akt2 cKO N). c p = 0.0065 (Akt2 fl/fl D vs. Akt2 fl/fl N), p = 0.037 (Akt2 cKO D vs. Akt2 fl/fl D). e p = 0.0247 (Akt2 fl/fl D vs. Akt2 fl/fl N), p = 0.0046 (Akt2 cKO D vs. Akt2 fl/fl D). g p < 0.0001 (Akt2 fl/fl D vs. Akt2 fl/fl N), p = 0.0039 (Akt2 cKO D vs. Akt2 fl/fl D). N nondiabetic, D diabetic, cKO conditional knockout.

