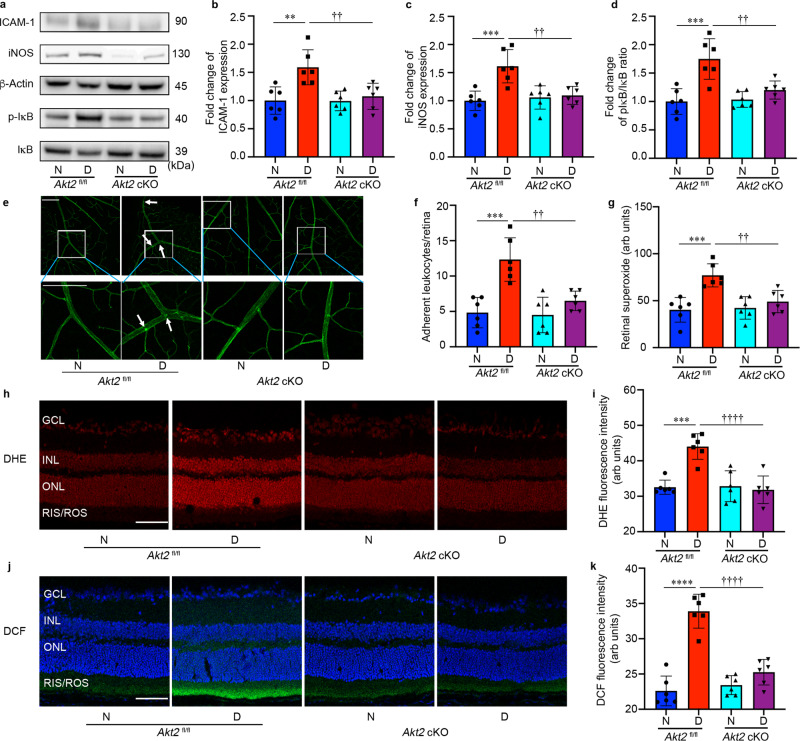
Fig. 2. RPE-specific Akt2 cKO inhibits the diabetes-induced increases in inflammatory proteins, leukostasis, and generation of reactive oxygen species in the mouse retina after 2 months of diabetes.
a Representative immunoblots and densitometry graphs demonstrating the diabetes-induced increases of (b) ICAM-1, (c) iNOS, and (d) the ratio of pIκB/IκB were inhibited in the retina of RPE-specific Akt2 cKO diabetic mice. e Representative images and (f) quantification of attached leukocytes in the retina. Arrows indicate leukocytes adherent to the retinal blood vessels. Diabetes increased the number of adherent leukocytes in the Akt2fl/fl diabetic retina compared to nondiabetic Akt2fl/fl mice; this number was markedly reduced in Akt2 cKO diabetic mice, Scale bar: 100 µm. g Retinal superoxide was measured using lucigenin; diabetes increased retinal production of superoxide in Akt2fl/fl mice. These levels were attenuated in Akt2 cKO diabetic mice. h Representative images and (i) quantification of DHE-stained (red) retinal sections showing the levels of ROS in each group. The DHE stain was primarily localized in the nuclear layers, Scale bar: 100 µm. The intensity of red fluorescence was quantified at the INL and ONL as they represent the majority of red staining in the retina. The diabetes-induced increase of ROS in Akt2fl/fl retina was not observed in diabetic Akt2 cKO mice. j Representative images and (k) quantification of DCF-stained retinal sections showing ROS accumulated in the inner and outer segments of photoreceptors. The blue stain is DAPI. The diabetic Akt2 cKO mice displayed significantly low retinal ROS levels compared to the diabetic Akt2fl/fl mice. Scale bar: 100 µm. Data are expressed as mean ± SD. **p < 0.01; ***p < 0.001; ****p < 0.0001 show changes versus Akt2fl/fl nondiabetic (N) controls. ††p < 0.01, and ††††p < 0.0001 show changes versus Akt2fl/fl diabetic (D) mice. Statistical test used in (b, c, d, f, g, i, k) is One-way ANOVA followed by a Tukey’s post hoc test. n = 6 mice for each group. Exact p values are: b p = 0.0024 (Akt2 fl/fl D vs. Akt2 fl/fl N), p = 0.0081 (Akt2 cKO D vs. Akt2 fl/fl D). c p = 0.0004 (Akt2 fl/fl D vs. Akt2 fl/fl N), p = 0.0024 (Akt2 cKO D vs. Akt2 fl/fl D). d p = 0.0001 (Akt2 fl/fl D vs. Akt2 fl/fl N), p = 0.0036 (Akt2 cKO D vs. Akt2 fl/fl D). f p = 0.0001 (Akt2 fl/fl D vs. Akt2 fl/fl N), p = 0.0019 (Akt2 cKO D vs. Akt2 fl/fl D). g p = 0.0003 (Akt2 fl/fl D vs. Akt2 fl/fl N), p = 0.0043 (Akt2 cKO D vs. Akt2 fl/fl D). i p = 0.0001 (Akt2 fl/fl D vs. Akt2 fl/fl N), p < 0.0001 (Akt2 cKO D vs. Akt2 fl/fl D). k p < 0.0001 (Akt2 fl/fl D vs. Akt2 fl/fl N, Akt2 cKO D vs. Akt2 fl/fl D). cKO conditional knockout, GCL ganglion cell layer, INL inner nuclear layer, ONL outer nuclear layer, RIS/ROS rod inner/outer segment, DHE dihydroethidium, DCF dichlorofluorescein. Source Data is provided in the Source Data file.

