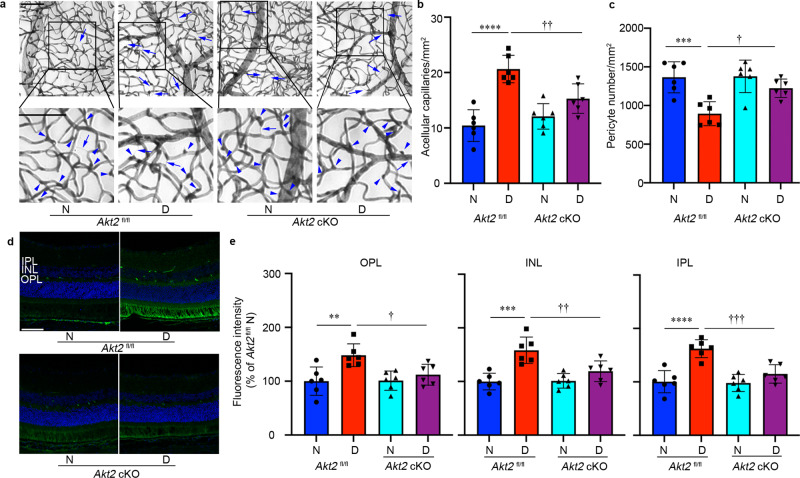
Fig. 4. RPE-specific Akt2 cKO inhibits the development of diabetes-induced retinal vascular lesions.
a Representative micrographs of retinal vessels from diabetic mice (8 months of diabetes) and age-matched nondiabetic mice. Arrows indicate degenerated capillaries and arrowheads indicate capillary pericytes. Scale bar: 100 µm. b Diabetes increased the number of degenerated capillaries and (c) decreased the number of retinal capillary pericytes in diabetic Akt2fl/fl mice compared to nondiabetic animals. RPE-specific Akt2 cKO partially rescued this degeneration. d Representative micrographs of retinal sections after mice were intravenously injected with FITC-albumin. Scale bar: 100 µm. e Average fluorescence intensity was quantified from a large area of INL, IPL, and OPL, excluding obvious microvessels. RPE-specific Akt2 cKO reduced the diabetes-induced accumulation of FITC-BSA in the OPL, INL, and IPL of mouse retina compared to diabetic Akt2fl/fl mice. In (b, c, e), n = 6 mice for each group, the data are expressed as mean ± SD. **p < 0.01; ***p < 0.001; ****p < 0.0001 versus Akt2fl/fl nondiabetic control (N). †p < 0.05; ††p < 0.01; †††p < 0.0001 versus Akt2fl/fl diabetic mice (D). Statistical test used in (b, c, e) is One-way ANOVA followed by a Tukey’s post hoc test. Exact p values are: b p < 0.0001 (Akt2 fl/fl D vs. Akt2 fl/fl N), p = 0.0096 (Akt2 cKO D vs. Akt2 fl/fl D). c p = 0.0008 (Akt2 fl/fl D vs. Akt2 fl/fl N), p = 0.0187 (Akt2 cKO D vs. Akt2 fl/fl D). e OPL, p = 0.0046 (Akt2 fl/fl D vs. Akt2 fl/fl N), p = 0.0388 (Akt2 cKO D vs. Akt2 fl/fl D); INL, p = 0.0002 (Akt2 fl/fl D vs. Akt2 fl/fl N), p = 0.0087 (Akt2 cKO D vs. Akt2 fl/fl D). IPL, p < 0.0001 (Akt2 fl/fl D vs. Akt2 fl/fl N), p = 0.0009 (Akt2 cKO D vs. Akt2 fl/fl D). cKO conditional knockout, IPL inner plexiform layer, INL inner nuclear layer, OPL outer plexiform layer.

