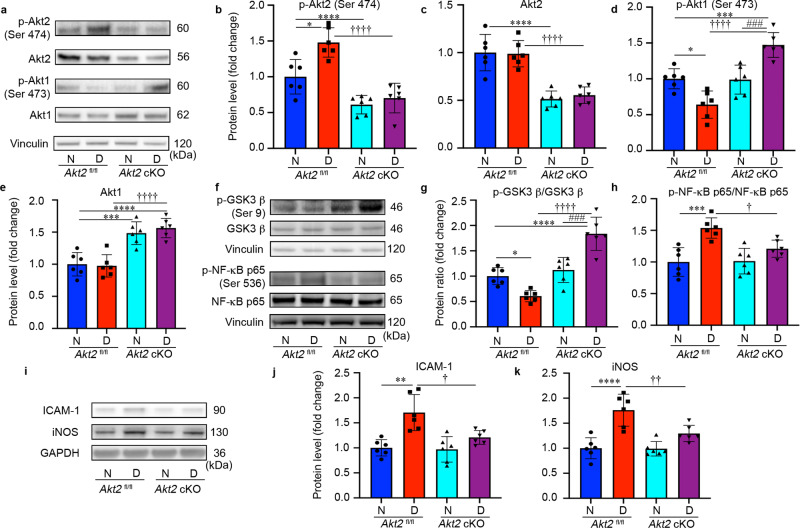
Fig. 8. Akt2 cKO promotes upregulation of Akt1 and inhibits the diabetes-induced inflammatory response through GSK3β/NF-κB signaling in the RPE cells (2 months of diabetes).
a Representative immunoblots and quantification of (b) phospho-Akt2, (c) total-Akt2, (d) phospho-Akt1 and (e) total Akt1 in RPE lysates obtained from diabetic and nondiabetic Akt2fl/fl and cKO mice. Diabetes increased the level of phospho-Akt2 but did not affect the levels of total Akt2 in Akt2fl/fl RPE cells compared to the nondiabetic control. RPE-specific Akt2 cKO reduced the levels of both phospho- and total-Akt2 in the RPE; induction of diabetes did not further affect the levels of either phospho- or total Akt2 in Akt2 cKO RPE. Induction of diabetes in Akt2fl/fl mice decreased the level of phospho-Akt1 but did not affect the levels of total Akt1 in the RPE cells compared to nondiabetic control. Akt2 cKO increased the levels of phospho-Akt1 in diabetic Akt2 cKO mice, but not in nondiabetic cKO mice compared to diabetic or nondiabetic Akt2fl/fl mice, respectively. The total Akt1 in the RPE was upregulated in both nondiabetic and diabetic Akt2 cKO mice compared to Akt2fl/fl mice. f Representative immunoblots. g The ratio of phospho-GSK3β/total GSK3β was lower in diabetic Akt2fl/fl mice, relative to nondiabetic control mice. However, it was increased in diabetic Akt2 cKO mice. h In addition, Akt2 cKO rescued the diabetes-induced increase in the ratio of p-NF-κB p65/total NF-κB p65. i Representative immunoblots. Diabetes induction increased the protein level of (j) ICAM-1 and (k) iNOS in Akt2fl/fl mice, whereas in diabetic Akt2 cKO mice this diabetes-induced increase in inflammatory protein levels was significantly rescued. In (b–e, g, h, j, k), n = 6 mice per group, the data are expressed as mean ± SD. *p < 0.05, **p < 0.01, ***p < 0.001, and ****p < 0.0001 denotes changes versus Akt2fl/fl nondiabetic (N) control. †p < 0.05, ††p < 0.01, †††p < 0.001, and ††††p < 0.0001 denotes changes with respect to Akt2fl/fl diabetic (D) mice. ###p < 0.001 and ####p < 0.0001 shows changes versus nondiabetic Akt2 cKO group. Statistical test used in this study is One-way ANOVA followed by a Tukey’s post hoc test. Exact p values are: b p = 0.025 (Akt2 fl/fl D vs. Akt2 fl/fl N), p < 0.0001 (Akt2 cKO N vs. Akt2 fl/fl N, Akt2 cKO D vs. Akt2 fl/fl D). c p < 0.0001 (Akt2 cKO N vs. Akt2 fl/fl N, Akt2 cKO D vs. Akt2 fl/fl D). d p = 0.0109 (Akt2 fl/fl D vs. Akt2 fl/fl N), p = 0.0009 (Akt2 cKO D vs. Akt2 fl/fl N), p < 0.0001 (Akt2 cKO D vs. Akt2 fl/fl D), p = 0.0007 (Akt2 cKO D vs. Akt2 cKO N). e p = 0.0005 (Akt2 cKO N vs. Akt2 fl/fl N), p < 0.0001 (Akt2 cKO D vs. Akt2 fl/fl N). p < 0.0001 (Akt2 cKO D vs. Akt2 fl/fl D). g p = 0.0326 (Akt2 fl/fl D vs. Akt2 fl/fl N), p = 0.0001 (Akt2 cKO D vs. Akt2 cKO N), p < 0.0001 for the rest. h p = 0.0003 (Akt2 fl/fl D vs. Akt2 fl/fl N), p = 0.0283 (Akt2 cKO D vs. Akt2 fl/fl D). j p = 0.0004 (Akt2 fl/fl D vs. Akt2 fl/fl N), p = 0.011 (Akt2 cKO D vs. Akt2 fl/fl D). k p < 0.0001 (Akt2 fl/fl D vs. Akt2 fl/fl N), p = 0.0076 (Akt2 cKO D vs. Akt2 fl/fl D). Source Data is provided in the Source Data file.

