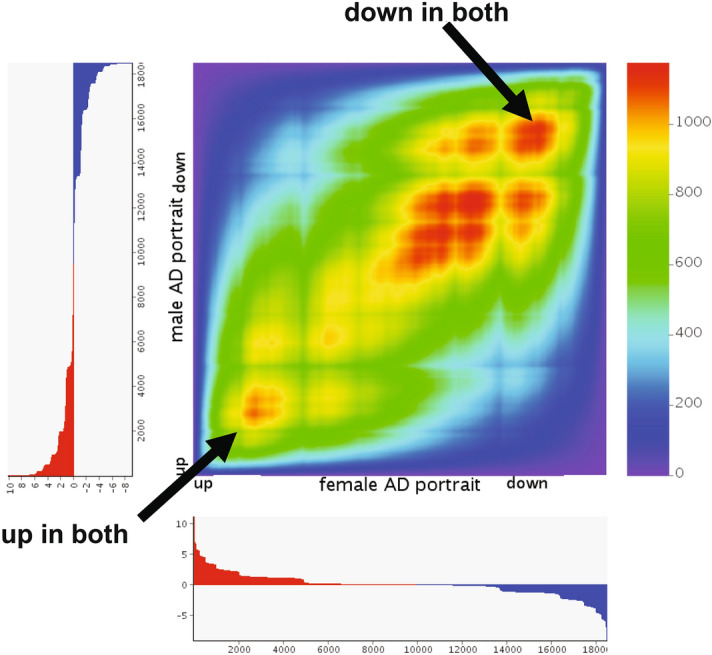
Figure 2.

High congruence of male and female AD portraits. RRHO heat map111 is shown for comparisons of the male AD portrait (Y axis) and the female AD portait (X axis). Color is − log transformed hypergeometric p value showing the strength of the overlap as positive or negative enrichment. There is a high level of similarity in downregulated genes in both male and female AD datasets (red in upper right quadrant; see arrow) and in upregulated genes in both datasets (red in lower left hand quadrant; see arrow). All genes are used in RRHO analysis and upregulated genes are shown in red and downregulated genes shown in blue in the axis for each comparison.
