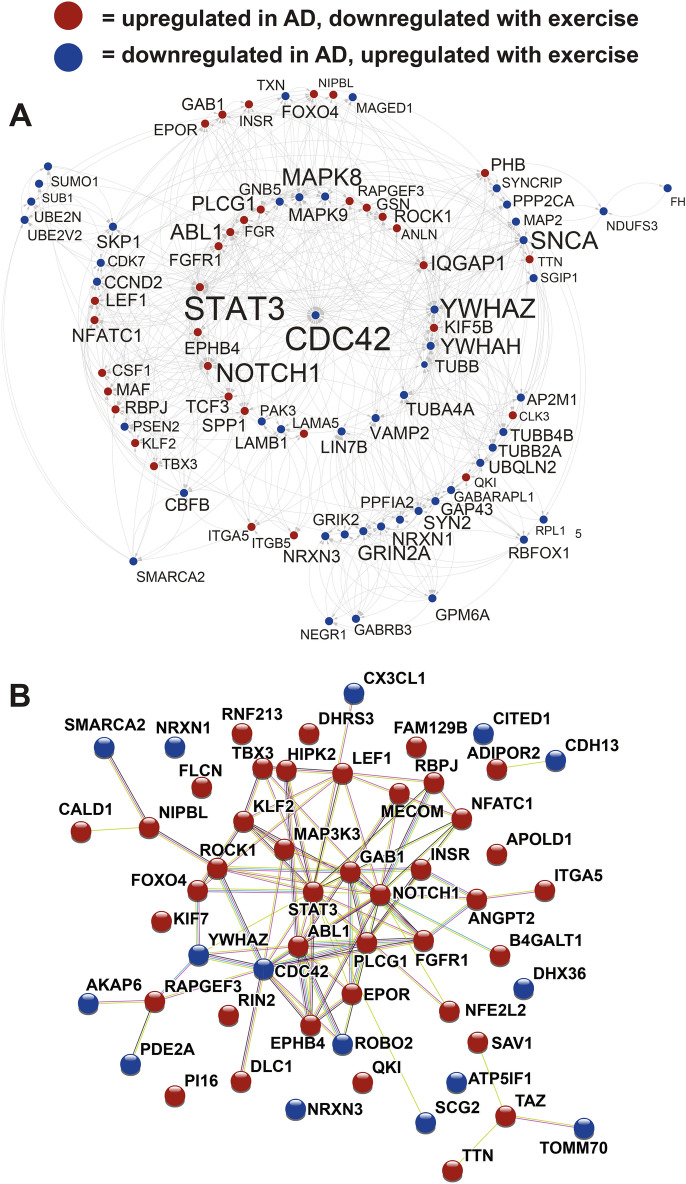
Figure 3.
AD dysregulated genes reversed by exercise (human dataset). (A) Genes with the highest levels of protein–protein interaction (determined via STRING15) from the 409 AD genes reversed by exercise (top treatment; human high versus low activity) are plotted in Cytoscape109. Increased size of font for gene symbol reflects higher number of connections between genes. CDC42, STAT3, NOTCH1, SNCA, YWHAZ, and MAPK8 were among the genes with the most connections. Interactions are highlighted by lines. (B) Blood vessel development genes were enriched within the AD genes reversed by exercise and are plotted in STRING15. Connections between proteins are shown by lines and color of line indicates type of evidence: light blue (known interactions from curated databases); pink (known interactions that are experimentally determined); green (predicted interactions from gene neighborhood); red (predicted interactions from gene fusions); blue (predicted interactions from gene co-occurrence); light green (text mining); black (co-expression); and gray (protein homology). AD upregulated genes downregulated by exercise are shown in red and AD downregulated genes upregulated by exercise are shown in blue for both (A,B).

