
Figure 3.
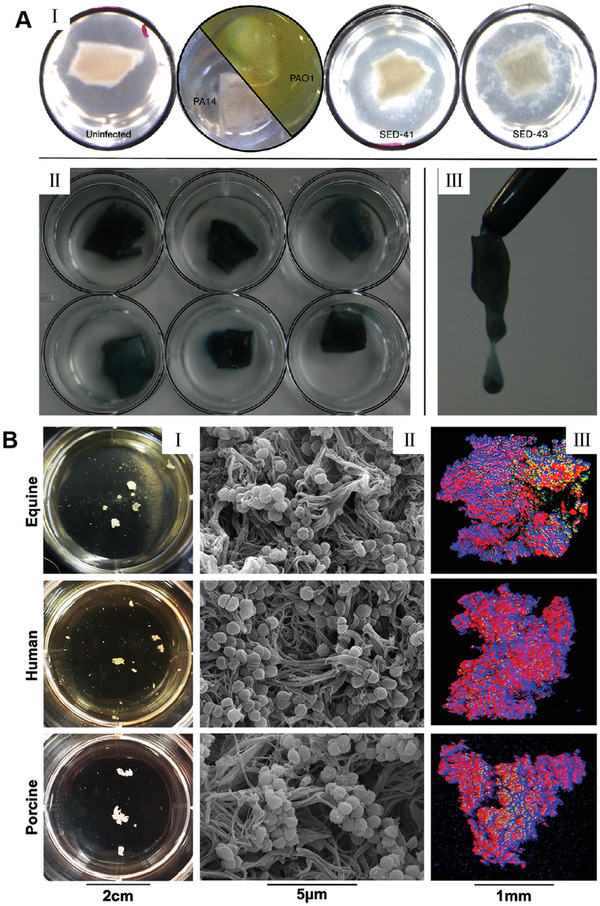
Two representative ex vivo biofilm models. A) An ex vivo lung model to study bronchioles infected with P. aeruginosa biofilms. I): EVPL in situ in ASM at 19 h post‐inoculation. Uninfected bronchiolar tissue retained its normal appearance: a pinkish‐white square with no noticeable degradation, surrounded by clear ASM. The laboratory strain PA14 did not show visible growth either on the tissue or in the surrounding ASM at this early stage; PAO1, in contrast, had grown extensively in the liquid ASM surrounding the tissue (green‐yellow pigmentation due to production of pyoverdine) but did not yet show any noticeable growth on the tissue itself‐note pinkish‐white square of tissue sitting in the liquid bacterial culture. In contrast, CF isolates of P. aeruginosa (e.g., SED‐41 and SED‐43) showed growth as frond‐like aggregates on and connected to the cubes of tissue, very different from the dense planktonic growth of PAO1. II) By 4 days post‐inoculation, CF isolates of P. aeruginosa had grown to a high density on EVPL. The image shows three replica infections of SED‐41 (top row) and SED‐43 (bottom row) after washing the tissue with phosphate‐buffered saline to remove non‐adhering cells: a coating of sticky P. aeruginosa, with blue‐green pigmentation (pyoverdine and pyocyanin), was left behind. III) These biofilms were noticeably mucoid (e.g., SED‐41). Reproduced with permission.[ 135 ] Copyright 2016, Microbiology Society. B) S. aureus forms macroscopic biofilm aggregates in the synovial fluid of several different species. Equine, human or porcine synovial fluid was infected at 1×10⁶ CFU/mL with S. aureus (ATCC25923) and incubated overnight at 37 °C in a microaerophilic chamber on a shaker at 120 rpm to mimic the joint environment. I): Macroscopic biofilm aggregates were observed in synovial fluid in all three species and photographed. II): Aggregates were removed from the synovial fluid, fixed, dehydrated in ethanol, sputter coated, and imaged with an SEM, showing bacteria nested within a polymeric cord‐like ECM. III) Aggregates were stained with WGA in blue for carbohydrates, SYTO9 in green for nucleic acids, and SYPRO in red for proteinaceous content. 3D CLSM images were reconstructed by sequential Z‐stacking and tile scanning with Velocity software. Reproduced with permission.[ 136 ] Copyright 2019, PLOS.