
Figure 1.
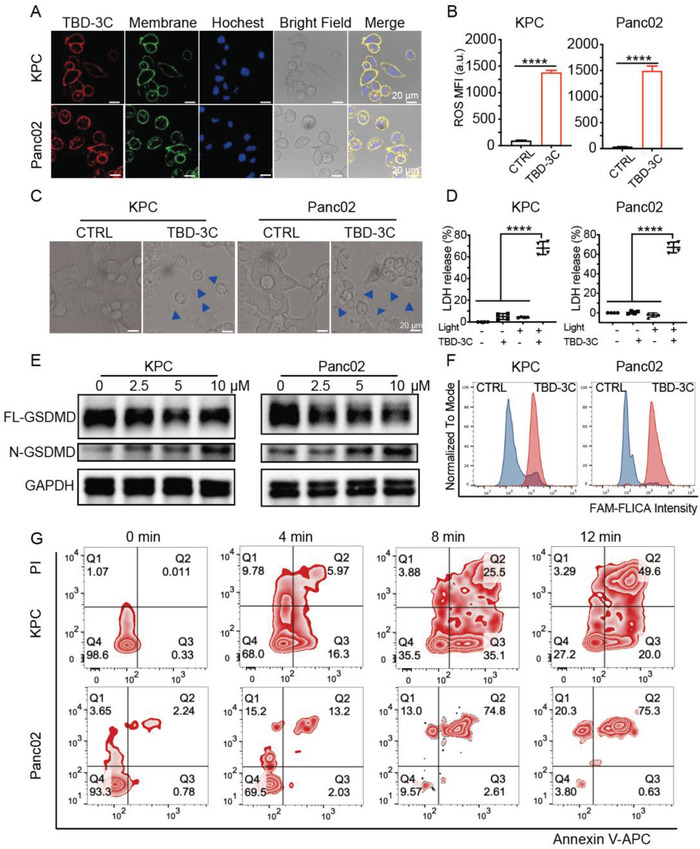
Membrane‐anchoring TBD‐3C stimulates the pyroptosis of pancreatic cancer cells by PDT. A) CLSM images of cells incubated with TBD‐3C (10 µm, 30 min, Red fluorescence, Ex is 405 nm, Em is from 600–680 nm), membrane tracker CellMask Green (Green fluorescence), and nuclei labeler (Blue fluorescence). Scale bar = 20 µm. B) ROS release of KPC and Panc02 cells labeled with TBD‐3C upon light irradiation at 40 mW cm−2 for 10 min (n = 3) (MFI, Mean Fluorescence Intensity). C) Confocal images of KPC and Panc02 cells labeled with TBD‐3C upon light irradiation at 40 mW cm−2 for 10 min, blue arrows indicate the cell membrane expansion. D) LDH generation of KPC and Panc02 cells labeled with TBD‐3C upon light irradiation at 40 mW cm−2 for 10 min (n = 4). E) Western blotting analysis of pyroptosis‐related protein expression (GSDMD‐FL, GSDMD‐N) in KPC cells and Panc02 cells after treatment with different concentrations of TBD‐3C after PDT stimulation. F) The caspase‐1 expression of KPC and Panc02 after PDT treatment by flow cytometry with FAM conjugated Caspase‐1 assay kit. G) Flow cytometry of propidium iodide and annexin V‐fluorescein isothiocyanate (APC)‐stained KPC and Panc02 cells labeled with TBD‐3C upon light irradiation at a power density of 40 mW cm−2 for 4, 8, 12 min, respectively. Data are presented as the mean ± SD. Statistical analysis was performed using the Student's t‐test (****p < 0.0001).