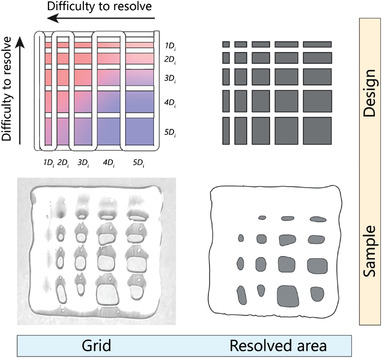
Figure 2.

A schematic and experimental representation of the metric used in this study to quantify printability. Top‐left) a 2‐layer grid design with varying fiber spacing was used to assess the printability of the formulations. The fiber spacing was increased by increments of inner nozzle diameter (D i = 410 µm). Bottom‐left) an image of an actual sample printed according to the grid design. Top‐right) The resolved area of design is used for benchmarking printability. Bottom‐right) The segmented image of a printed formulation is used to calculate the percentage of resolved area.
