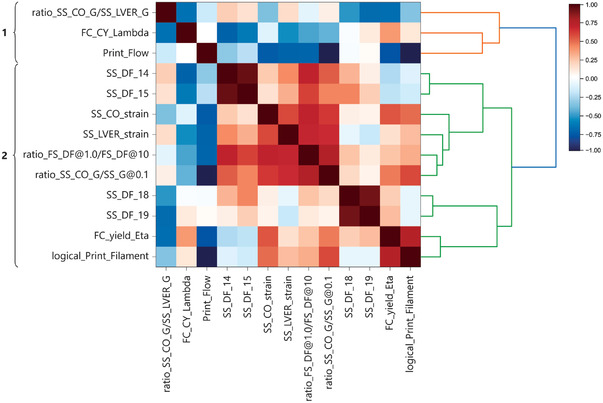
Figure 3.

The dendrogram shows the Spearman rank‐order correlation matrix and the linkage according to hierarchical cluster analysis of Spearman's correlations. The numbers on the left identified two clusters. A value of 1 or −1 in the correlation matrix denotes high correlations, and the direction of association depends on the sign of the correlation coefficient.
