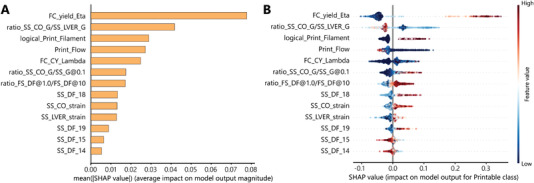
Figure 4.

SHAP values of different features show their contributions to the model output on two scales. A) on a global scale, the mean SHAP value represents the feature's average impact on the predictions made by the model. B) on a local scale, the rank‐ordered features explain the margin output of the model, which is the change in printability of formulations. The plot also shows the range of influence over the dataset. The color shows how the change in the value of a feature affects the change in the printability prediction.
