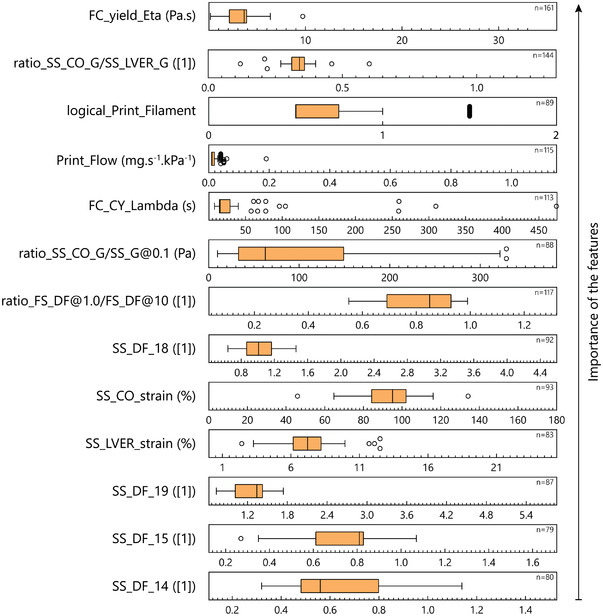
Figure 5.

Decision rules in the random forest algorithm are shown by box‐and‐whisker plots (Tukey, outliers in open circles) across the full range of each feature. The importance of the features increased from the bottom to the top of the graph. The number of total splitting nodes based on each feature is indicated by n.
