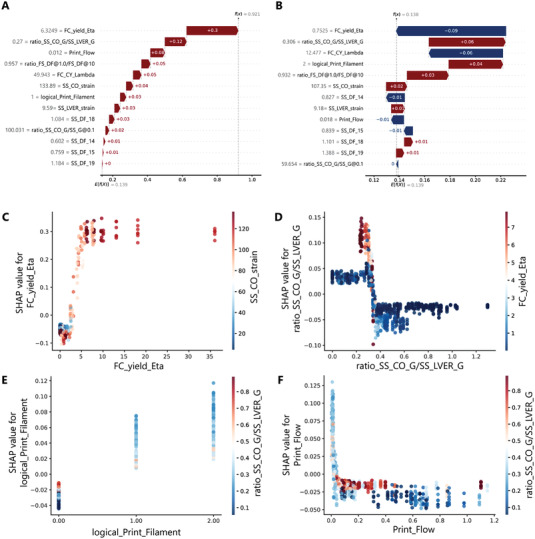
Figure 6.

The explanations for individual predictions and SHAP dependence plots of some notable combinations of features. The Waterfall plots showing the collaborative influence (positive: red, negative: blue) of rheological characteristics in a randomly chosen prediction resulted in A) significantly positive offset of the model's output (dashed vertical lines) from the baseline value of the model (E(f(x)), and B) an accumulative contribution resulting in a negligible offset of the model's output from the baseline value. Grey numbers indicate the actual value of the features per observation. The dependency plots show the SHAP value for C) yield viscosity, D) plasticity of formulation before the flow, E) the likelihood of filament formation during the extrusion, and F) the proportionality index of the flow.
