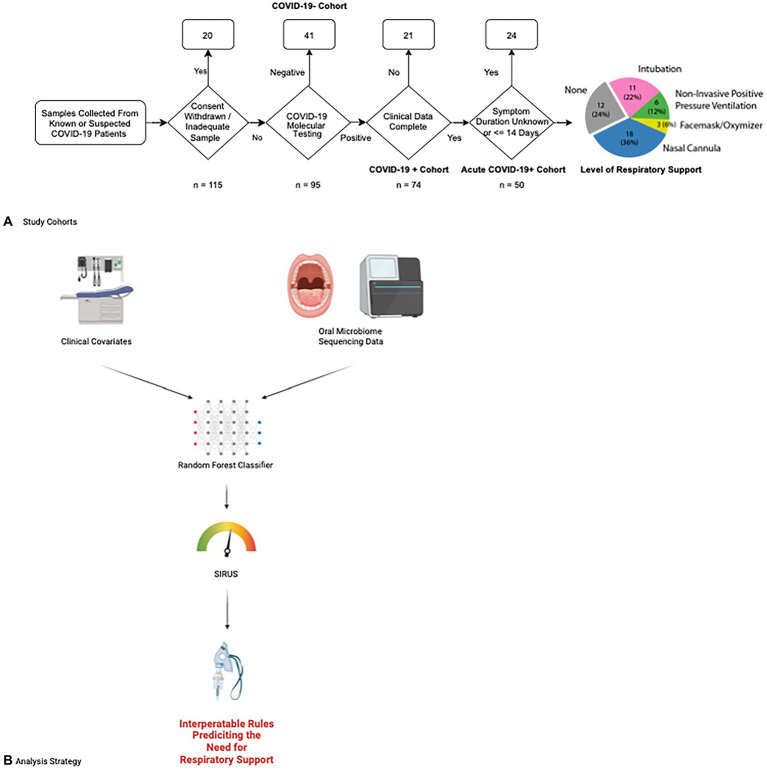
Figure 1.
Study enrollment and data analysis flowcharts. (A) Patients at UMass Medical center were enrolled for our study according to the following flow chart. Fifty patients with acute COVID-19 were ultimately selected for our study cohort and followed for a clinical outcome of whether they needed respiratory support and what level of respiratory support was required, ranging from supplemental oxygen via simple nasal cannula escalating through intubation and mechanical ventilation. The number of patients requiring each level of respiratory support is shown in the final chart on the right. (B) Data from clinical covariates and microbiome sequencing results are combined in a random forest classifier to determine features predicting the need for respiratory support. We then applied the Stable and Interpretable RUle Set (SIRUS) to these results to generate easily interpretable rules predicting which clinical covariates and microbiome features are predictive of the need for respiratory support.

