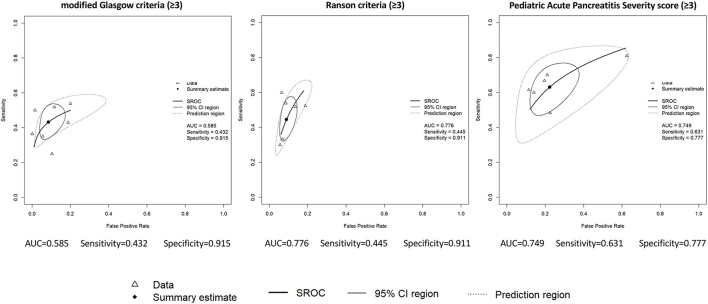
Figure 2.
Hierarchical summary receiver operating characteristic (HSROC) curves. Data are presented for the following predictive score systems: modified Glasgow criteria, Ranson criteria, Pediatric Acute Pancreatitis Severity score. The values used as cut-off for indicating a moderate or severe disease are given in brackets. Triangles represent data obtained from individual studies, rectangles represent the summary estimates, bold solid line the summary receiver operating curve, solid line the 95% CI region, dotted line the prediction region. AUC, area under the curve; CI, confidence interval; SROC, summary receiver operating characteristic curve.

