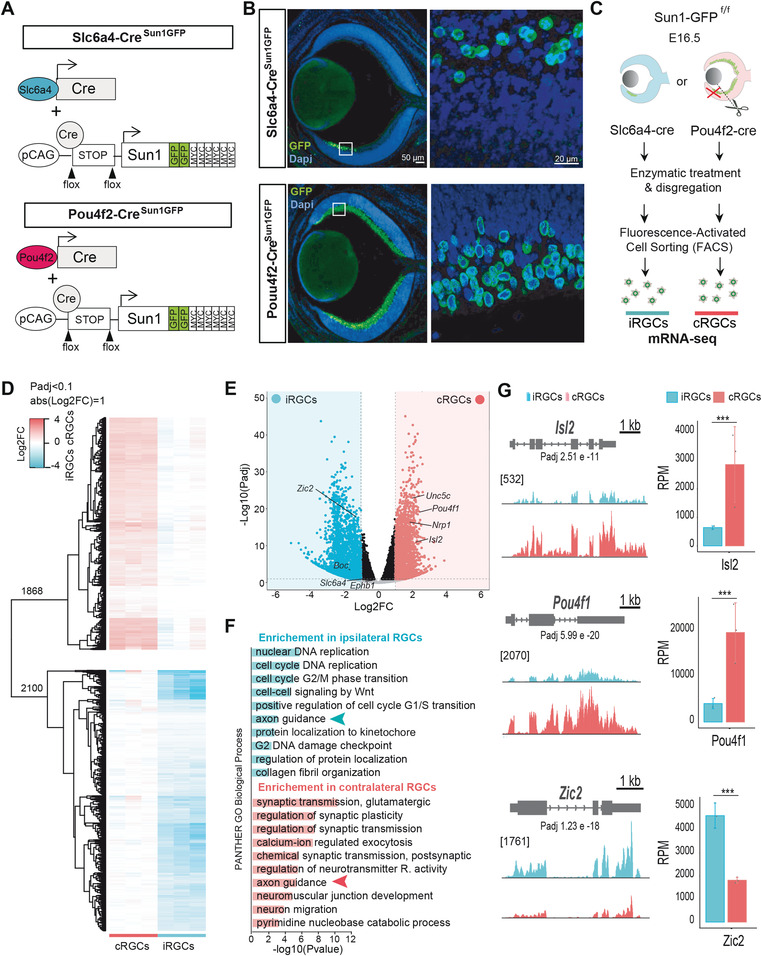
Figure 1.

Transcriptome differences among ipsilateral retinal ganglion cells (iRGCs) and contralateral retinal ganglion cells (cRGCs). A) Diagram showing the generation of Pou4f2Sun1GFP and Slc6a4Sun1GFP mouse lines. The cre recombinase‐driver lines Slc6a4‐Cre and Pou4f2‐Cre were crossed with a conditional reporter line that contains a CAG‐[Stop] cassette followed by the nuclear envelope protein Sun1 cDNA sequence fused to GFP. B) Coronal retinal sections from E16.5 Slc6a4‐CreSun1GFP or Pou4f2‐CreSun1GFP embryos immunostained against GFP and counterstained with DAPI demonstrate that this line specifically labels the nuclear envelope of iRGCs or RGCs, respectively. Scale bar: 50 µm. High magnification of the squared area shows labeled iRGCs. Scale bar: 20 µm. C) Experimental approach used to isolate iRGCs from Slc6a4‐CreSun1GFP embryos and cRGCs from Pou4f2‐CreSun1GFP embryos after removal of the VT region, to perform mRNA‐seq and compare their transcriptomes. D) Heatmap of fold changes in differentially expressed genes (DEGs) retrieved in the RNA‐seq screen between iRGCs and cRGCs. In the upper part cRGC DEGs refer to the iRGC rowMeans and in the lower part iRGC DEGs refer to the cRGC rowMeans. E) Volcano plot showing the significance and p‐value distribution after differential transcript abundance analysis between iRGCs and cRGCs populations. F) Histogram for Panther Gene Ontology (GO) Biological Process terms in DEGs in iRGCs and cRGCs. The bar graphs present the significance of the enrichment. Padj < 0.05 and |log2FC| ≥ 1. G. RNA‐seq profiles of transcription factors known to play key roles in the guidance of cRGCs (Isl2 and Pou4f1) or iRGCs (Zic2) axons. The vertical scale shows counts in reads per million (RPM). Average RPMs for each gene in the iRGC and the cRGC populations are represented in the graphs at the right. (***Padj < 0.001).
