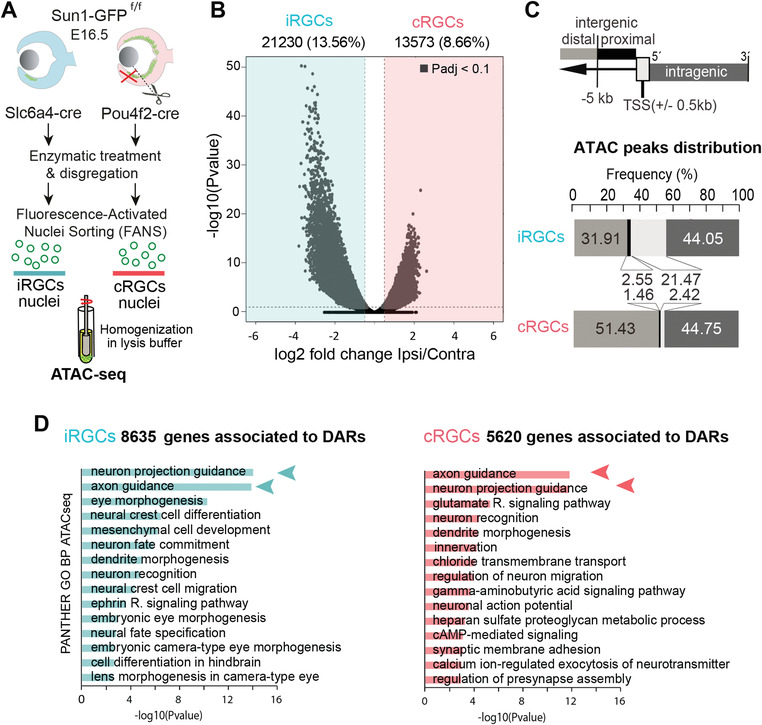
Figure 2.

Chromatin accessibility differences between contralateral retinal ganglion cells (cRGCs) and ipsilateral retinal ganglion cells (iRGCs). A) Experimental approach used to isolate iRGCs nuclei from Slc6a4‐CreSun1GFP embryos and cRGC nuclei from Pou4f2‐CreSun1GFP embryos (with the VT region removed) at E16.5 in order to perform ATAC‐seq assay. B) Volcano plot showing the significance value distribution after differentially accessible region (DAR) analysis between iRGCs and cRGCs populations; upper values indicate number of regions and percentage of all the accessible regions detected (Padj < 0.1). C) ATAC peaks distribution analysis of highly significant DARs at the promoter (TSS +/− 500 pb), proximal enhancer regions (between 0.5 and 5 kb upstream of the TSS), distal enhancer regions (more than 5 kb upstream of the TSS), and in the intragenic regions. The analysis shows the frequency (%) and the number of peaks in each region in the iRGC and cRGC populations. D) Panther Gene Ontology (GO) Biological Process enrichment analysis of DARs in cRGCs and iRGCs. Padj < 0.05 and |log2FC| ≥ 1.
