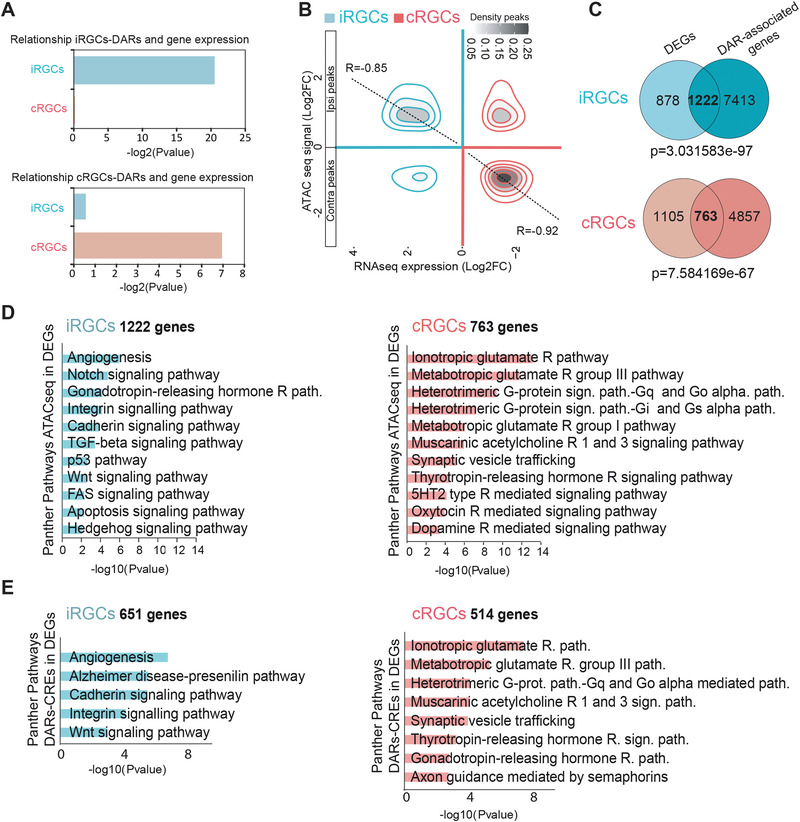
Figure 3.

Transcriptomic and chromatin occupancy profiles define the set of genes differentially expressed in ipsilateral retinal ganglion cell (iRGC) and contralateral retinal ganglion cells (cRGCs). A) BETA P values confirm the association between differentially accessible regions (DARs) and gene expression (DEGs) in both iRGCs and cRGCs. B) Density plot showing chromatin accessibility regions and gene expression. Pearson correlation confirmed significant relationship between ATAC‐seq with RNA‐seq from iRGCs (R = 0.85) and ATAC‐seq combined with RNA‐seq for cRGCs (R = 0.92). C) Venn diagrams showing the overlap between peak‐associated genes from ATAC‐seq and DEGs from RNA‐Seq changes in iRGCs and cRGCs populations. Fisher's exact tests were used to evaluate if the number of ATAC‐seq peaks associated with genes was statistically significative. For ATAC‐seq peaks (Padj < 0.05 and |Log2FC|>1) we considered differential peaks between cRGC and iRGC that are associated with DEGs. Thus, there may be a number of peaks associated with the same gene. D) Panther pathways Gene Ontology (GO) enrichment analysis of DARs in cRGCs and iRGCs. Padj < 0.05 and |log2FC| ≥ 1. E) Panther pathways GO analysis of DEGs with DARs at cis regulatory elements (CREs). Padj < 0.05 and |log2FC| ≥ 1.
