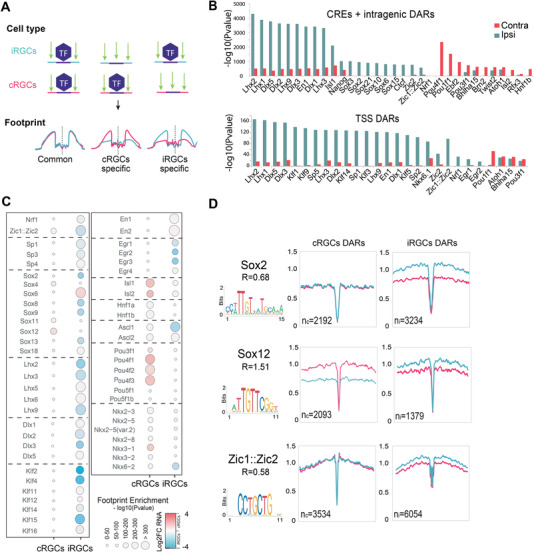
Figure 4.

Transcription factor footprints in ipsilateral retinal ganglion cell (iRGC) and contralateral retinal ganglion cells (cRGCs). A) Diagram representation to illustrate the transcription factor (TF) binding enforcing characteristic patterns in the chromatin (footprint) of iRGCs and cRGCs. B) TF footprint enrichment at differential accessible regions (DARs) for cRGCs and iRGCs. We performed separated analysis in promoters (TSS) and putative enhancers (CRE) regions. C) Digital footprinting at enhancer/promoter sites indicating the motif enrichment (circle size) and the associated TF expression change in iRGC or cRGC RNA‐seq datasets. Red: upregulated; blue: downregulated; white: no‐change. D) Digital footprinting at enriched motifs specific for the indicated transcription factors. n = number of motifs detected in cRGCs (n c) or iRGCs (n i) (values correspond to normalized tn5 insertions). Motif matrix from JASPAR database is shown for each transcription factor. R = n c/n i
