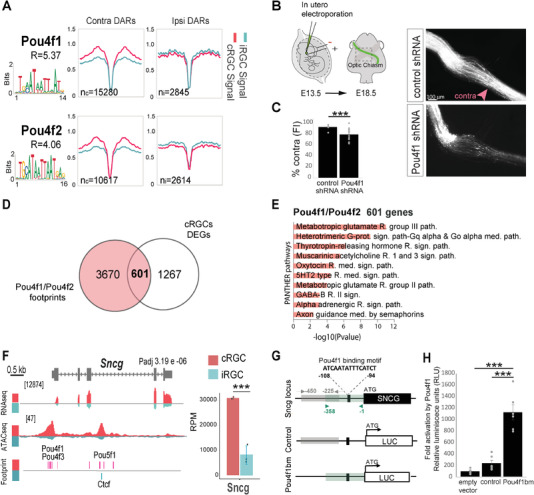
Figure 5.

Pou4f1 controls midline crossing. A) Digital footprinting at enriched motifs in Pou4f1 and Pou4f2. n = number of motifs detected in contralateral retinal ganglion cells (cRGCs; n c) or ipsilateral retinal ganglion cells (iRGCs; n i) (values correspond to normalized tn5 insertions). Motif matrix from JASPAR database is shown for each transcription factor. R = n c/n i. B) Left panel is a schematic drawing of the experimental approach. Monocular in utero electroporation with plasmids encoding EGFP is performed in E13.5 embryos and their optic chiasms are analyzed at E18.5. Right panels despite optic chiasms of E18.5 embryos electroporated at E13.5 with plasmids encoding for scramble shRNA (control) or Pou4f1 shRNA plus EGFP encoding plasmids. Scale bar: 100 µm. C) Percentage of ipsilaterally projecting axons at the optic chiasm normalized to the total number of targeted axons (n = number of embryos; Control n = 6, Pou4f1 shRNA n = 16) (two‐tailed unpaired t test, ***p < 0.001). Results show means ± SEM. D) Venn diagram showing the overlap between differentially expressed genes (DEGs) in the cRGCs population and the footprints of Pou4f1 and Pou4f2 annotated to the nearest gene. E) Panther pathways Gene Ontology (GO) enrichment analysis of DEGs associated to the Pou4f1 and Pouf4f2 footprints in cRGCs. Padj < 0.1 and |log2FC| ≥ 1. F. Genomic snapshots of ATAC‐seq, RNA‐seq profiles and footprints in iRGCs and cRGCs populations for the γ‐synuclein encoding gene (Sncg). Notice that several footprints for Pou4f factors located upstream and inside Sncg are detected specifically for cRGCs. Values indicate the levels of counts in reads per million (RPM). Graphs represent transcripts expression (in RPM) for Sncg obtained from iRGC or cRGCs RNA‐seq experiments. (***Padj < 0.001). G) Schematic representation of Sncg gene including the Pou4f1 binding motif located in the promoter region of the gene, the region of 358 bp containing the Pou4f1 binding motif (pou4f1bm) amplified by PCR to be cloned in a luciferase reporter plasmid (pGL3‐basic) to generate the pGL3‐Sncg‐cre plasmid and the region of 225 bp next to the Sncg‐cre excluding the Pou4f1 motif amplified to be cloned into the pGL3 and used as a control (pGL3‐control). H) Luciferase assay in HEK293 cells showing a stronger transactivation of the reporter gene driven by Pou4f1 binding to its motif in Sncg gene respect to controls (n = number of samples; empty vector n = 6, control n = 6, pou4f1bm n = 6) (ANOVA test; followed by Bonferroni correction, ***p < 0.001).
