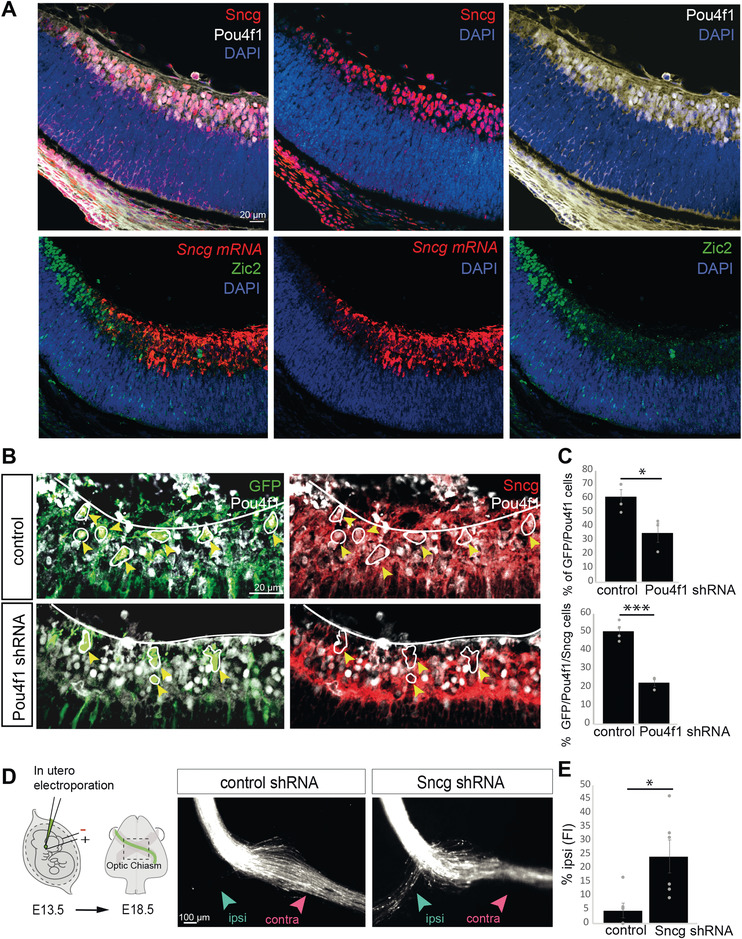
Figure 6.

Pou4f1 regulation of γ‐synuclein. A) Immunofluorescence for Sncg combined with immunofluorescence for Pou4f1 (upper) or Zic2 (bottom) in coronal retinal sections from E16.5 embryos. Nuclei are counterstained with Dapi. Scale bar: 20 µm. B) Immunofluorescence for Sncg combined with immunofluorescence for Pou4f1 or GFP in coronal retinal sections from E18.5 embryos after retina electroporation with plasmids encoding for scramble shRNA (control) (upper panels) or Pou4f1 shRNA (bottom panels) plus EGFP encoding plasmids. Scale bar: 20 µm. C) Quantification of the percentage of GFP/Pou4f1 positive cells and GFP/Pou4f1/Sncg positive cells in retinal sections from E18.5 embryos after retina electroporation with plasmids encoding for scramble shRNA (control) or Pou4f1 shRNA plus EGFP encoding plasmids (n = number of embryos; Control n = 4, Pou4f1 shRNA n = 3) (at least three sections for animal) (two‐tailed unpaired t test, *p < 0.05, ***p < 0.001). Results show means ± SEM. D) Left panel is a schematic drawing of the experimental approach. Monocular in utero electroporation with plasmids encoding EGFP is performed in E13.5 embryos and their optic chiasms are analyzed at E18.5. Right panels despite optic chiasms of E18.5 embryos electroporated at E13.5 with plasmids encoding for scramble shRNA (control) or Sncg shRNA plus EGFP encoding plasmids. Scale bar: 100 µm. E) Percentage of ipsilaterally projecting axons at the optic chiasm normalized to the total number of targeted axons (n = number of embryos; Control n = 6, Sncg shRNA n = 6) (two‐tailed unpaired t test, *p < 0.05). Results show means ± SEM.
