FIGURE 3:
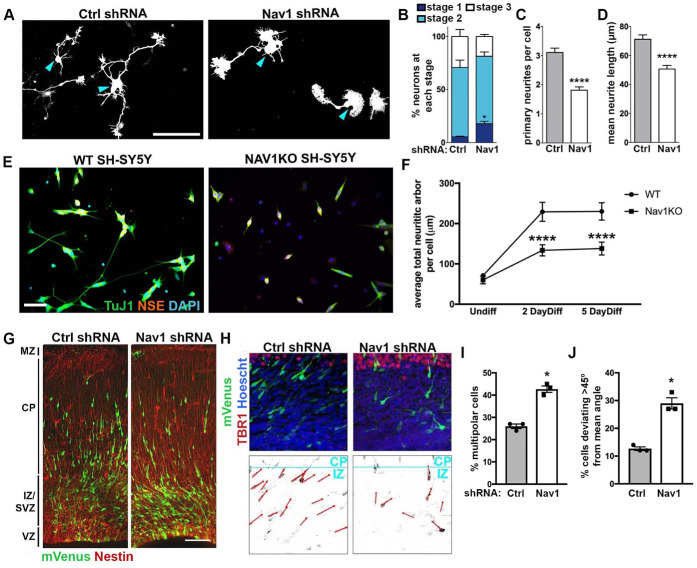
Nav1 deficiency disrupts neuritogenesis. (A) Hippocampal neurons were electroporated on the day of plating to express GFP as a transfection marker and either control shRNA (Ctrl shRNA) or Nav1 shRNA. Neurons were fixed after 3 DIV and stained for GFP and βIII-tubulin to specifically identify neurons. Representative GFP images are shown; blue arrowheads indicate the cell body. Scale bar = 100 μm. (B) Quantification of neurite growth in Ctrl and Nav1 shRNA electroporated dissociated hippocampal neurons: neurons were classified into different stages as described in Materials and Methods. Stacked histogram showing that knockdown of Nav1 increases the percentage of cells in stage 1. Statistical analysis: two-way ANOVA with Bonferroni post hoc comparisons, *p < 0.05; n = 3 experiments; control shRNA = 240 cells, Nav1 shRNA = 352 cells. (C) Nav1-supressed neurons show a decrease in the number of primary neurites per cell. Statistical analysis: Mann–Whitney test, ****p < 0.0001. Same n as in B. (D) Nav1-suppressed neurons show decreased mean neurite length. Mann–Whitney test, ****p < 0.0001. Same n as in B. (E) Representative images showing WT and Nav1KO SH-SY5Y cells after 2 d of BDNF differentiation as described in Materials and Methods. Scale bar = 50 μm. (F) Nav1KO cells have reduced neurite growth over time. Neurite length quantified as described in Materials and Methods. Statistical analysis: Kruskal–Wallis, Dunn’s multiple comparisons, ****p < 0.0001; n = 3 experiments; Undiff WT = 226 images, Undiff Nav1KO = 238 images, 2 d diff WT = 234 images, 2 d diff Nav1KO = 193 images, 5 d diff WT = 232 images, 5 d diff Nav1KO = 175 images. (G) Typical example of neuronal morphology and orientation of cells electroporated on E15.5 with mVenus (detected using antibody to GFP; green) and either Ctrl shRNA or Nav1 shRNA. Tissue was fixed and counterstained with anti-nestin antibody (red) on E18.5. Scale bar = 100 μm. (H) Representative images of control shRNA and Nav1 shRNA-expressing neurons (green) illustrating the vector (red) used to measure the angle to the pial surface (blue). Tbr1 antibody was used to label the cortical plate (CP). Scale bar = 10 μm. (I) Quantification of the effect of Nav1 shRNA on the percentage of cells in the multipolar stage within the intermediate zone (IZ)/subventricular zone (SVZ). Statistical analysis: t test, two tailed, *p < 0.05; control shRNA vector, n = 3 experiments with six embryos, 527 neurons; Nav1 shRNA vector, n = 3 experiments with seven embryos, 635 neurons. (J) Quantification of the effect of Nav1 shRNA on neuron orientation in the lower IZ and SVZ. Angle of orientation in control vs. shRNA-expressing neurons was quantified as described in Materials and Methods. Statistical analysis: t test, two-tailed, *p < 0.05; control shRNA vector, n = 3 experiments with six embryos, 966 neurons; Nav1 shRNA vector, n = 3 experiments with seven embryos, 717 neurons All data are expressed as mean ± SEM.

