FIGURE 4:
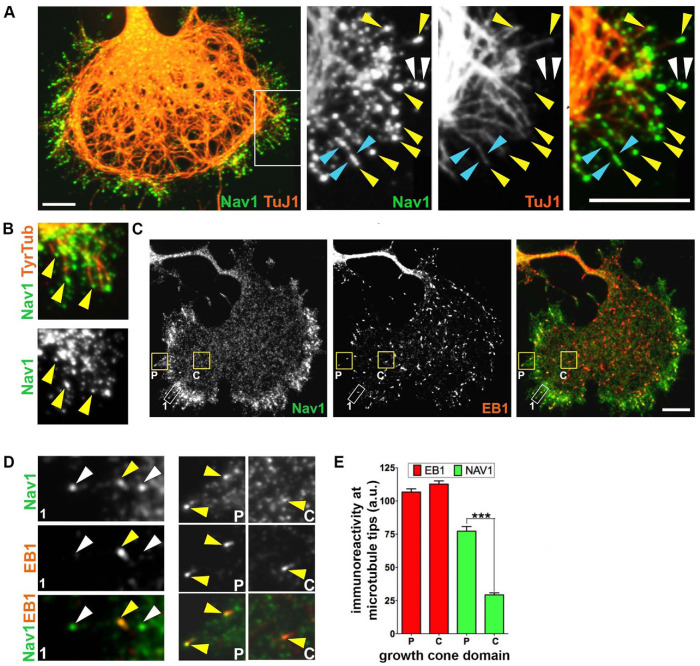
Nav1 is a +TIP that associates with EB1 in the growth cone. (A) Growth cone stained for Nav1 and neuron-specific marker TuJ1 (βIII-tubulin). The white box indicates the region enlarged in three panels to the right. Note that Nav1 puncta are present at the tips of MTs in the periphery of the growth cone. Yellow arrowheads indicate Nav1 puncta at the tips of individual MTs; blue arrowheads indicate Nav1 puncta arrayed along MTs; white arrowheads indicate Nav1 puncta not colocalized with detectable MTs. (B) Nav1 localizes to the tips of newly polymerized MTs (arrowheads) labeled with antibody to tyrosinated tubulin. (C) Growth cone immunostained for Nav1 and EB1. Note that the overall distribution of Nav1 is different from that of EB1; Nav1 puncta accumulate in the growth cone periphery, while EB1 puncta distribute more uniformly. Boxed regions are shown at higher magnification in D. (D) Box 1 is zoomed region outlined by white rectangle, box P (P-domain) and box C (C-domain) are outlined in yellow rectangles in C. Note that of the three Nav1 puncta in box 1 (arrowheads) only one detectably colocalizes with EB1 (yellow arrowhead). Arrowheads in box P indicate two intense Nav1 puncta that colocalize with intense EB1 puncta. Single arrowhead in box C indicates a faint Nav1 punctum that colocalizes with an intense EB1 punctum. (Note that the display settings in zoomed regions are enhanced from those in B.) (E) Quantification of the relative concentrations of endogenous EB1 and Nav1 at MT tips in the P-domain vs. the C-domain. This assay indicates that Nav1 concentration at plus ends is greater in the P-domain compared with the C-domain. Statistical analysis: Mann–Whitney test; ***p < 0.001; n = 3 experiments; P-domain = 234 comets; C-domain = 243 comets. a.u. = arbitrary units. All scale bars = 10 μm. All data are expressed as mean ± SEM. Images represent observations from three individual culture preparations.

