FIGURE 6:
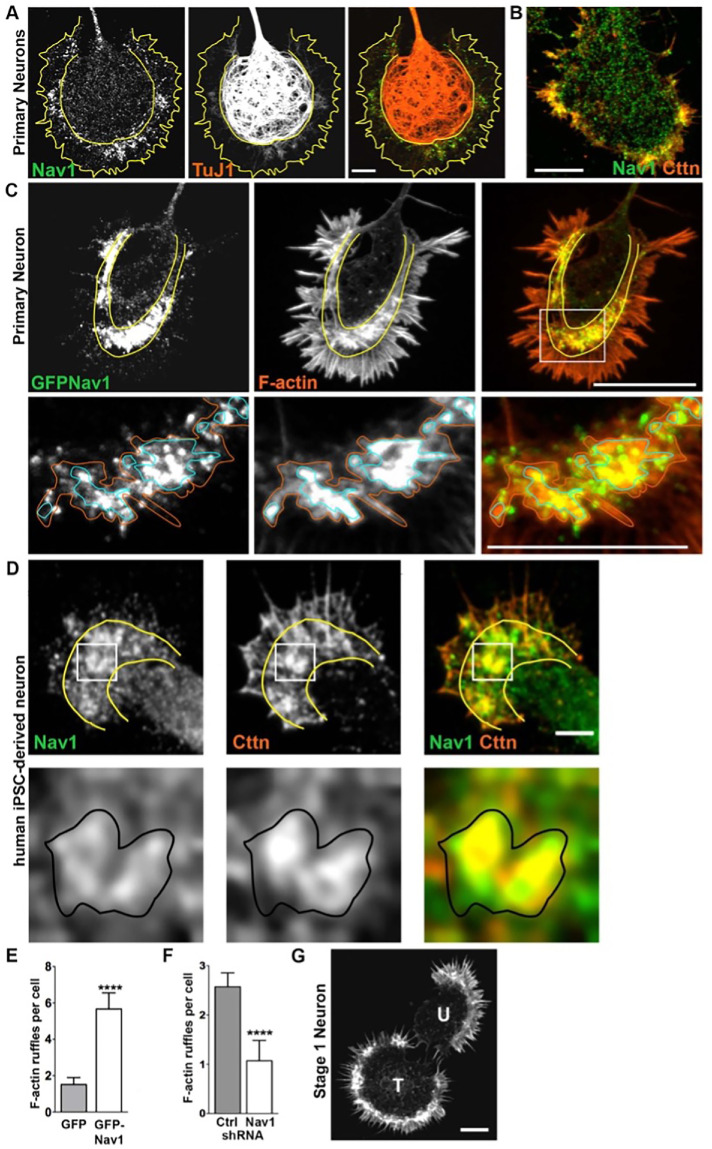
Nav1 associates with and regulates F-actin membrane ruffles in the transition zone (T-zone) in the growth cone. (A) Cultured rat embryonic neurons were fixed on 3 DIV and double labeled for endogenous Nav1 and βIII-tubulin (TuJ1). Growth cone domain borders are highlighted with solid yellow lines. Note the accumulation of endogenous Nav1 puncta within clusters in the T-zone. Scale bar = 10 μm. (B) Growth cone stained for endogenous Nav1 and the actin-binding protein cortactin (Cttn), which is a marker of actin-rich membrane ruffles. Scale bar = 20 μm. (C) Growth cone from a stage 2 hippocampal neuron expressing GFP-Nav1, labeled for F-actin by Alexa Fluor 568–conjugated phalloidin. Boxed region is enlarged in panel directly below. Note that clusters of GFP-Nav1 puncta are enriched within the T-zone and their concentration correlates with that of F-actin. Orange and blue solid lines indicate regions of moderate and intense concentrations, respectively, of F-actin, which correspond to membrane ruffles. Scale bars: top panel 20 μm, bottom panel 10 μm. (D) Differentiated human iPSC–derived neurons were fixed and double labeled for endogenous Nav1 and Cttn. Yellow lines indicate growth cone domain borders. Boxed region is enlarged in panel directly below. Black solid lines indicate membrane ruffle where both Cttn and Nav1 are enriched. Scale bar = 10 μm. (E) GFP-Nav1 overexpression increases the number of F-actin ruffles per neuron. Mann–Whitney test, ****p < 0.0001; n = 3 experiments; GFP transfected = 29 cells; GFP-Nav1 transfected = 30 cells. (F) Knockdown of endogenous Nav1 using shRNA decreases the number of F-actin–rich membrane ruffles per neuron. Mann–Whitney test, ****p < 0.0001; n = 3 experiments; control and Nav1 shRNA = 70 cells each. (G) Two stage 1 neurons stained with Alexa Fluor 568–conjugated phalloidin. Note that the cell transfected with GFP-Nav1 (“T”) shows large accumulations of F-actin within the periphery compared with the adjacent untransfected neuron (“U”). Scale bar = 20 μm. All data are expressed as mean ± SEM. Images represent observations from three individual culture preparations.

