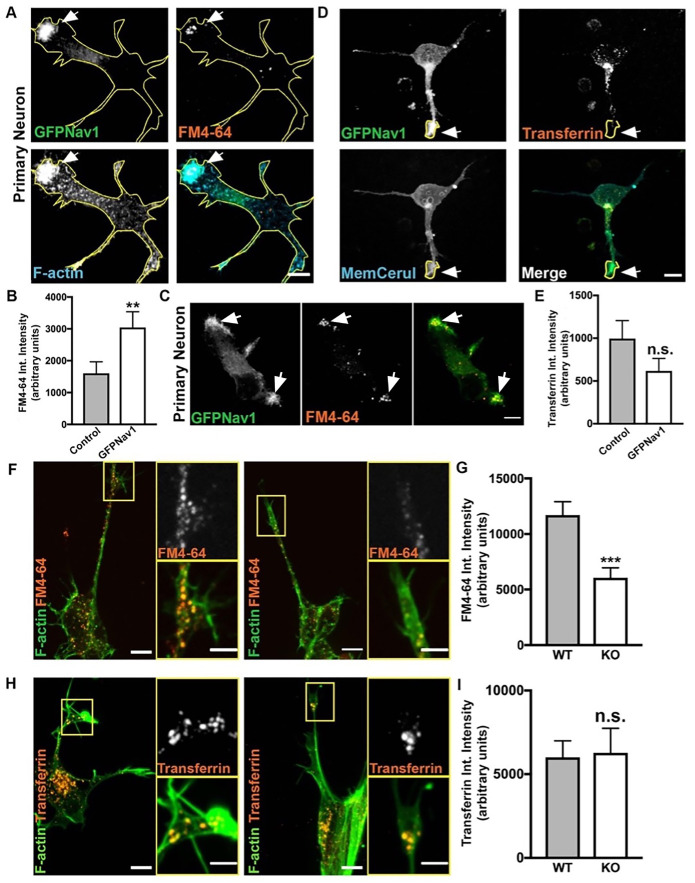
FIGURE 7:
Nav1 promotes endocytosis at F-actin membrane ruffles. (A) Representative image of 3 DIV hippocampal neurons transfected with GFP-Nav1 (green), pcs-CeruleanMembrane-FP (used to make yellow cell outline), incubated with FM4-64 (red), and incubated with Alexa Fluor 647–conjugated phalloidin (blue) demonstrates that Nav1-enriched F-actin ruffles are sites of FM4-64 uptake. Arrow points to region enriched in GFP-Nav1, F-actin, and FM4-64. Scale bar = 10 μm. (B) Growth cones expressing GFP-Nav1 and pcs-CeruleanMembrane-FP have significantly more FM4-64 uptake than growth cones expressing just pcs-CeruleanMembrane-FP. Statistical analysis: Mann–Whitney, **p < 0.01; n = 4 experiments; control = 69 growth cones, GFP-Nav1 = 69 growth cones. (C) Representative image of 3 DIV stage 1 hippocampal neuron transfected with GFP-Nav1 (green) and incubated with FM4-64 (red) demonstrating that FM4-64 is taken up in GFP-Nav1–enriched areas (white arrows). Scale bar = 10 μm. (D) Representative image of 3 DIV hippocampal neurons transfected with GFP-Nav1 (green) and pcs-CeruleanMembrane-FP (blue) and incubated with Alexa Fluor 568–conjugated transferrin (red). Scale bar = 10 μm. (E) There is no difference in transferrin intensity between GFP-Nav1–expressing and control growth cones. Statistical analysis: Mann–Whitney test, n.s. = not significant; n = 4 experiments; control = 34 growth cones, GFP-Nav1 = 42 growth cones. (F) Representative image of 7 d differentiated WT and Nav1KO SH-SY5Y cells with phalloidin-labeled F-actin (green) and incubated with FM4-64 (red). Scale bar = 10 μm, 5 μm for zoomed image. (G) Nav1KO SH-SY5Y growth cones have less FM4-64 uptake than WT cells, as measured by FM4-64 intensity. Statistical analysis: Mann–Whitney, ***p < 0.001; n = 4 experiments; WT = 185 growth cones, KO = 116 growth cones. (H) Representative images of 7 d differentiated WT and Nav1KO SH-SY5Y cells with phalloidin-labeled F-actin (red) and incubated with transferrin (red). Scale bar = 10 μm, 5 μm for zoomed image. (I) There is no significant difference in transferrin intensity between WT and Nav1KO SH-SY5Y cells. Statistical analysis: Mann–Whitney, n.s. = not significant; n = 4 experiments; WT = 83 growth cones, KO = 59 growth cones. All data are expressed as mean ± SEM. Images represent observations from three individual culture preparations.

