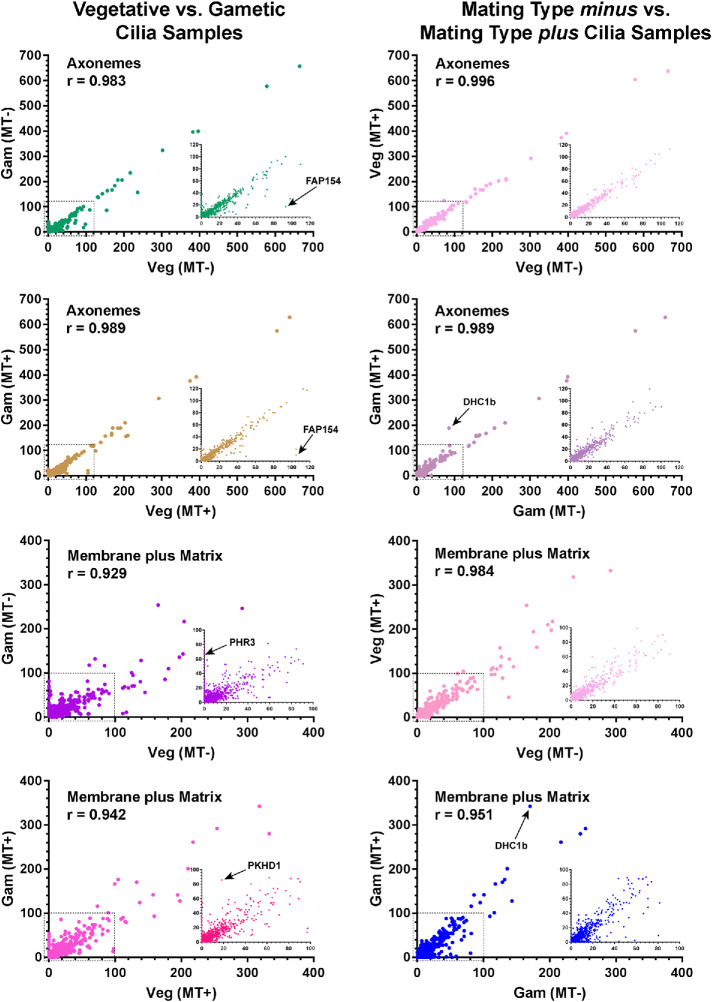
FIGURE 2:
Relative abundance of proteins in vegetative and gametic cilia. The abundance of each protein (normalized total spectral count; average of n = 3) identified in vegetative and gametic cilia from both mating type minus and plus cells is represented in scatterplots; the Pearson correlation coefficients (r) for each comparative analysis are shown. The insets show expanded views of the regions indicated by the dashed boxes. The abundance of nearly all axonemal proteins is highly correlated between samples. Several proteins that show highly distinct abundance changes are indicated: FAP154 (Cre08.g362100) contains a PAS domain; PHR3 (Cre12.g532850) is a multipass transmembrane protein in the ionotropic glutamate receptor family; and PKHD1 (Cre07.g340450) is a signal peptide–containing transmembrane protein with pectin lyase, G8, and immunoglobulin-like folds. Intriguingly, the dynein heavy chain (DHC1b) that powers retrograde intraflagellar transport shows a significant increase in mating type plus gamete cilia. The major membrane glycoprotein FMG1 is not shown on the membrane plus matrix plots, as it is present at >threefold the amount of any other protein, and thus its inclusion greatly distorts the data by forcing all other points much closer to the ordinate. A single data point in the mating type minus vegetative vs. gametic membrane comparison is obscured by the inset.

