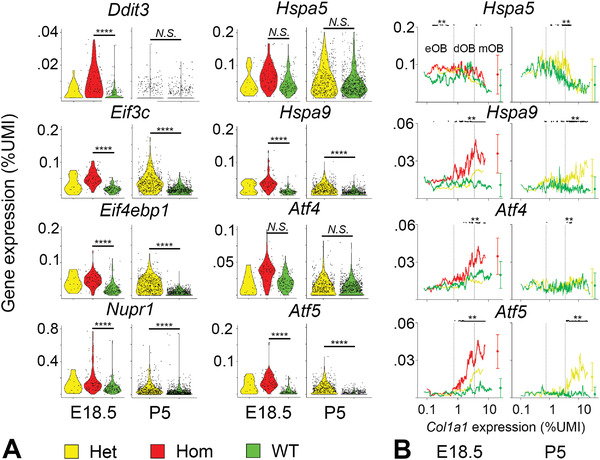
Figure 3.

Expression of UPR and ISR genes. A) Violin plots of Ddit3, Eif3c, Eif4ebp1, Nupr1, Hspa5, Hspa9, Atf4, and Atf5 expression in mature osteoblasts (mOBs). More than 20% change in gene expression with p < 0.05 (Wilcoxon test with Bonferroni correction) was considered significant. N.S. = not significant, **** p < 0.0001. B) Dependence of Hspa5, Hspa9, Atf4, and Atf5 expression on Col1a1 transcription (running average over 20 cells sorted in the order of increasing Col1a1). Small black dots on top mark mRNA upregulation in Hom versus WT (E18.5) and Het versus WT (P5) with estimated significance of at least ** p < 0.01. Circles with error bars show mean transcription in mOBs and mean value of the standard deviation for the running average across the full range of Col1a1.
