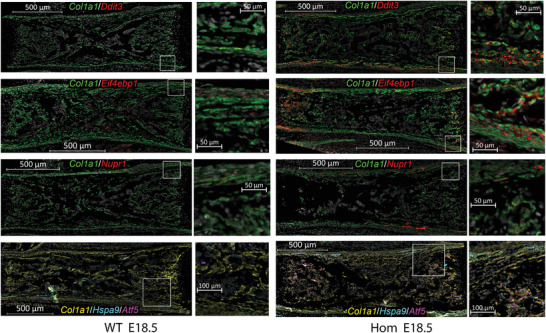
Figure 5.

Visualization of Ddit3, Eif4ebp1, Nupr1, Hspa9, and Atf5 mRNA in fixed, paraffin embedded sections of E18.5 femurs. Fluorescent in situ hybridization (FISH) of mRNA in WT and Hom tissue sections was performed at the same time, with the same reagents, and at identical conditions. The slides were imaged at identical fluorescence channel settings and digitally visualized with identical contrast enhancement to preserve relative fluorescence intensity. Cell nuclei labeled with DAPI are shown in grayscale. The other pseudo colors correspond to the gene symbol colors of the corresponding legends. Intense Col1a1 labeling identifies OBs while weaker Col1a1 labeling is observed in fibroblasts (mostly within periosteum). White boxes outline regions shown in zoomed panels.
