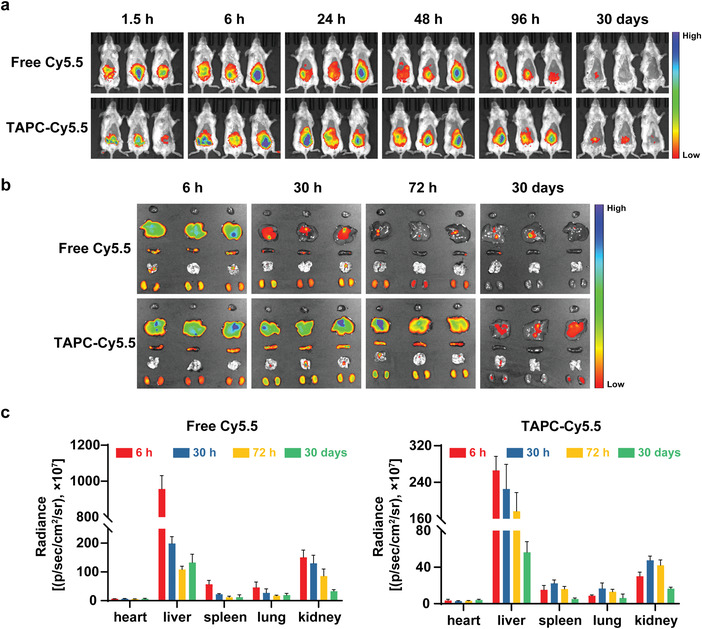
Figure 4.

Distribution and excretion of TAPC‐4 in normal BALB/c mice via intraperitoneal injection. a) In vivo fluorescence imaging of the mice after injection of TAPC‐Cy5.5 or free Cy5.5 (n = 3). b) Ex vivo fluorescence imaging of heart, liver, spleen, lungs, and kidneys (n = 3). c) Quantification of the fluorescence intensity in the organs from panel (b). Cy5.5‐eq. dose, 0.1 mg kg−1 (Mean ± SEM).
