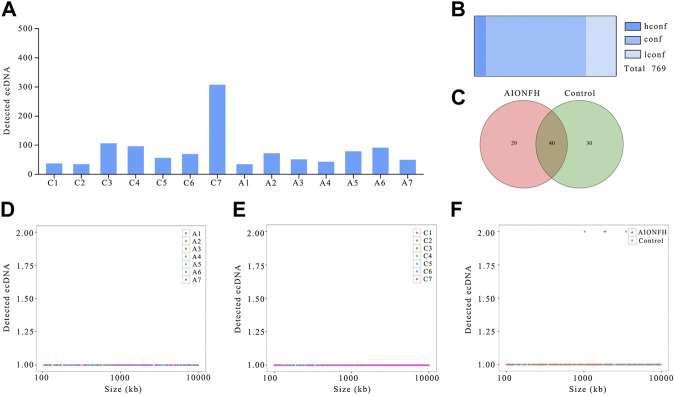
FIGURE 2.
EcDNAs number, sizes distribution of AIONFH group and control group. (A). The total amount of ecDNAs detected in each sample. (B). Confidence of identified ecDNAs. (C). Venn diagram showed the consist ecDNAs detected in AIONFH and control samples. (D–F). The length distribution of ecDNAs (100kb–10000 kb) in each group.

