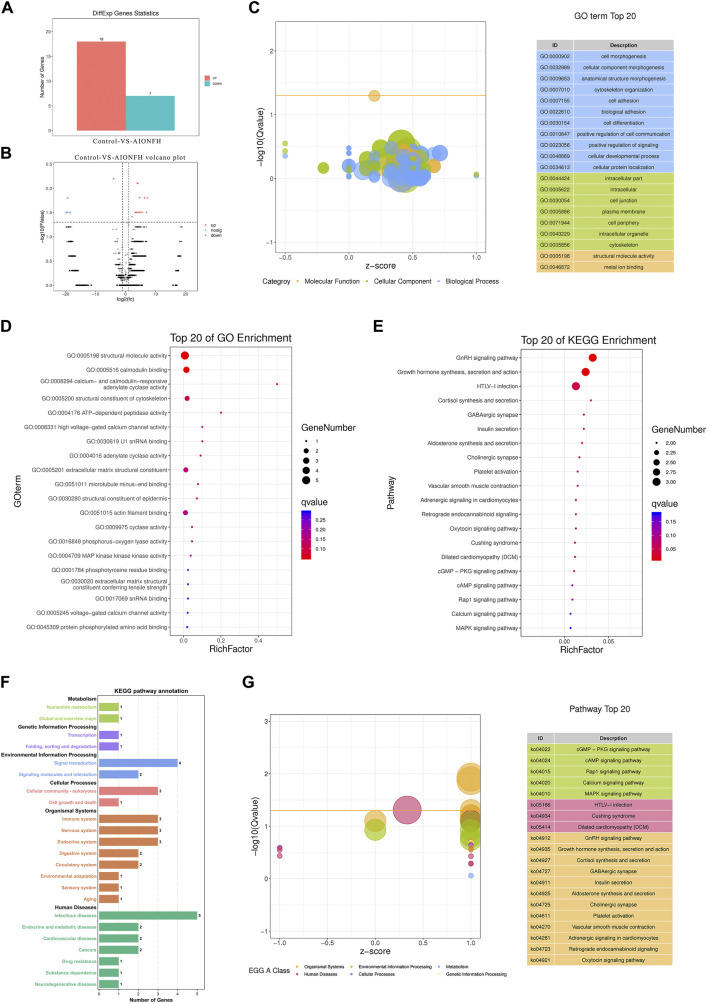
FIGURE 6.
Bioinformatic analysis of exon region of gene in eccDNAs. (A). Upregulated and downregulated eccDNAs related exon region genes. (B). Volcano plot shows the different genes. (C,D). GO biological process classification of genes and top 20 of GO terms enriched in the plot Figure (E–G). KEGG function enrichment analysis.

