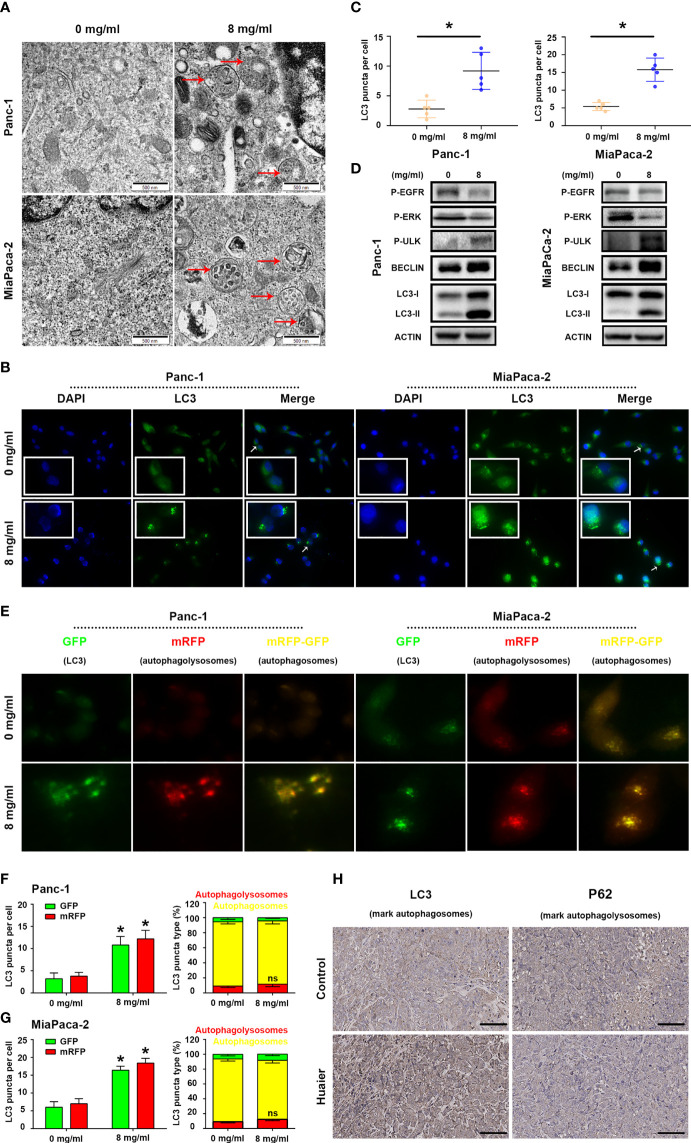
Figure 4.
Huaier induced autophagy in pancreatic cancer. (A) TEM images showing autophagosomes (red arrows) in the Panc-1 and MiaPaCa-2 cells after the Huaier treatment. (B, C) Immunofluorescence staining of LC3 puncta (white arrows) and statistical analysis of the Panc-1 and MiaPaCa-2 cells after Huaier treatment. (D) Western blotting showing the protein levels of P‐EGFR, P-ERK, P-ULK, BECLIN and LC3 in Panc-1 and MiaPaCa-2 cells after Huaier treatment. (E–G) ad-mRFP-GFP-LC3-based fluorescence images of autophagosomes (yellow) and autophagolysosomes (red) and their statistical analysis in Panc-1 and MiaPaCa-2 cells after Huaier treatment. (H) IHC staining of LC3 and P62 showing the autophagy status of pancreatic cancer tumours in the control and Huaier groups. *P < 0.05, scale bar = 100 μm.

