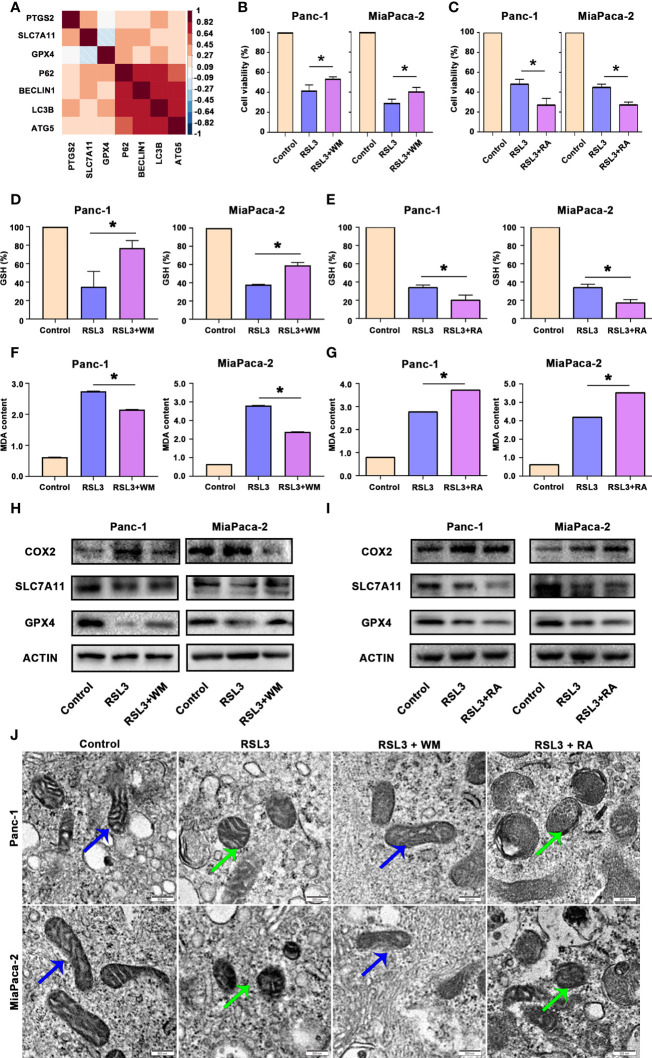
Figure 5.
Autophagy promoted ferroptosis in pancreatic cancer. (A) Hierarchical clustering results in the TCGA-PAAD cohort of 7 genes involved in ferroptosis and autophagy. Correlation map reporting Spearman correlation values for each comparison. The bar on the left of the map indicates the colour legend of the Pearson correlation values calculated for each pair of genes in the matrix. (B) CCK8 assay showing the viability of Panc-1 and MiaPaCa-2 cells after the control, RSL3 and RSL3 plus wortmannin (WM) treatments for 96 h. (C) CCK8 assay showing the viability of Panc-1 and MiaPaCa-2 cells after the control, RSL3 and RSL3 plus rapamycin (RA) treatments for 96 h. (D, F) The measurement of GSH and MDA concentrations in Panc-1 and MiaPaCa-2 cells after the control, RSL3 and RSL3 plus WM treatments. (E, G) The measurement of GSH and MDA concentrations in Panc-1 and MiaPaCa-2 cells after the control, RSL3 and RSL3 plus RA treatments. (H) Western blotting showing the protein levels of COX2, GPX4 and SLC7A11 in RSL3 in Panc-1 and MiaPaCa-2 cells after the control, RSL3 and RSL3 plus WM treatments. (I) Western blotting showing the protein levels of COX2, GPX4 and SLC7A11 in RSL3 in Panc-1 and MiaPaCa-2 cells after the control, RSL3 and RSL3 plus RA treatments. (J) TEM images showing mitochondria (blue arrows reflect normal like and green arrows reflect ferroptosis like) in Panc-1 and MiaPaCa-2 cells after the control, RSL3, RSL3 plus WM and RSL3 plus RA treatments. *P < 0.05, scale bar = 500 nm.

